|
|
Information box |
The main purpose of this site is to extend the
intraoperative monitoring to include the neurophysiologic
parameters with intraoperative navigation guided with Skyra 3
tesla MRI and other radiologic facilities to merge the
morphologic and histochemical data in concordance with the
functional data.
 CNS Clinic
Located in Jordan Amman near Al-Shmaisani hospital, where all
ambulatory activity is going on.
Contact: Tel: +96265677695, +96265677694.
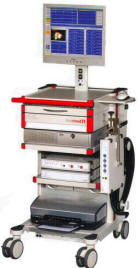
Skyra running
A magnetom Skyra 3 tesla MRI with all clinical applications
started to run in our hospital in 28-October-2013.
Shmaisani hospital
The hospital where the project is located and running diagnostic
and surgical activity. |
|
 |
|
|
 |
Introduction |
 |
Magnetic resonance spectroscopy (MRS) is used to measure the
levels of different metabolites in body tissues. The MR signal
produces a spectrum of resonances that correspond to different
molecular arrangements of the isotope being "excited". This
signature is used to diagnose certain metabolic disorders,
especially those affecting the brain, and to provide information
on tumor metabolism.
Magnetic resonance spectroscopic imaging (MRSI) combines both
spectroscopic and imaging methods to produce spatially localized
spectra from within the sample or patient. The spatial
resolution is much lower (limited by the available SNR), but the
spectra in each voxel contains information about many
metabolites. Because the available signal is used to encode
spatial and spectral information, MRSI requires high SNR
achievable only at higher field strengths (3 T and above).
 |
Sequences |
 |
(MRS / MRSI - Magnetic
Resonance Spectroscopic Imaging) A method using
the NMR phenomenon to identify the chemical
state of various elements without destroying the
sample. MRS therefore provides information about
the chemical composition of the tissues and the
changes in chemical composition, which may occur
with disease processes.
Although MRS is primarily employed as a research
tool and has yet to achieve widespread
acceptance in routine clinical practice, there
is a growing realization that a noninvasive
technique, which monitors disease biochemistry
can provide important new information for the
clinician.
The underlying principle of MRS is that atomic
nuclei are surrounded by a cloud of electrons,
which very slightly shield the nucleus from any
external magnetic field. As the structure of the
electron cloud is specific to an individual
molecule or compound, then the magnitude of this
screening effect is also a characteristic of the
chemical environment of individual nuclei.
In view of the fact that the resonant frequency
is proportional to the magnetic field that it
experiences, it follows that the resonant
frequency will be determined not only by the
external applied field, but also by the small
field shift generated by the electron cloud.
This shift in frequency is called the chemical
shift (see also Chemical Shift). It should be
noted that chemical shift is a very small
effect, usually expressed in ppm of the main
frequency. In order to resolve the different
chemical species, it is therefore necessary to
achieve very high levels of homogeneity of the
main magnetic field B0. Spectra from humans
usually require shimming the magnet to
approximately one part in 100. High resolution
spectra of liquid samples demand a homogeneity
of about one part in 1000.
In addition to the effects of factors such as
relaxation times that can affect the NMR signal,
as seen in magnetic resonance imaging, effects
such as J-modulation or the transfer of
magnetization after selective excitation of
particular spectral lines can affect the
relative strengths of spectral lines.
In the context of human MRS, two nuclei are of
particular interest - H-1 and P-31. (PMRS -
Proton Magnetic Resonance Spectroscopy) PMRS is
mainly employed in studies of the brain where
prominent peaks arise from NAA, choline
containing compounds, creatine and creatine
phosphate, myo-inositol and, if present,
lactate; phosphorus 31 MR spectroscopy detects
compounds involved in energy metabolism
(creatine phosphate, adenosine triphosphate and
inorganic phosphate) and certain compounds
related to membrane synthesis and degradation.
The frequencies of certain lines may also be
affected by factors such as the local pH. It is
also possible to determine intracellular pH
because the inorganic phosphate peak position is
pH sensitive.
If the field is uniform over the volume of the
sample, "similar" nuclei will contribute a
particular frequency component to the detected
response signal irrespective of their individual
positions in the sample. Since nuclei of
different elements resonate at different
frequencies, each element in the sample
contributes a different frequency component. A
chemical analysis can then be conducted by
analyzing the MR response signal into its
frequency components.
 Binomial Pulses
A sequence of two or more pulses with a null response at a
particular frequency used to suppress the water signal in
localized proton spectroscopy.
Chemical Shift Imaging
(CSI) Chemical shift imaging is an extension of MR spectroscopy,
allowing metabolite information to be measured in an extended
region and to add the chemical analysis of body tissues to the
potential clinical utility of Magnetic Resonance. The spatial
location is phase encoded and a spectrum is recorded at each
phase encoding step to allow the spectra acquisition in a number
of volumes covering the whole sample. CSI provides mapping of
chemical shifts, analog to individual spectral lines or groups
of lines.
Spatial resolution can be in one, two or three dimensions, but
with long acquisition times od full 3D CSI. Commonly a
slice-selected 2D acquisition is used. The chemical composition
of each voxel is represented by spectra, or as an image in which
the signal intensity depends on the concentration of an
individual metabolite. Alternatively frequency-selective pulses
exite only a single spectral component.
There are several methods of performing chemical shift imaging,
e.g. the inversion recovery method, chemical shift selective
imaging sequence, chemical shift insensitive slice selective RF
pulse, the saturation method, spatial and chemical shift encoded
excitation and quantitative chemical shift imaging.
Chemical Shift Selective Imaging Sequence
(CHESS) A sequence for water suppression in proton MR
spectroscopy and for water or fat suppression in MR imaging.
This technique uses a frequency-selective 90° pulse to
selectively excite the water signal, followed by a spoiler
gradient to dephase the resulting magnetization. The gradients
may be repeated several times in different directions to
increase its effectiveness.
Depth Resolved Spectroscopy
(DRESS) Depth resolved surface spectroscopy is a localization
method that employ gradients to select the region from which
spectra are acquired.
Point Resolved Spectroscopy
(PRESS) Point resolved spectroscopy is a multi echo single shot
technique to obtain spectral data. PRESS is a 90°-180°-180°
(slice selective pulses) sequence. The 90° radio frequency pulse
rotates the spins in the yx-plane, followed by the first 180°
pulse (spin rotation in the xz-plane) and the second 180° pulse
(spin rotation in the xy-plane), which gives the signal.
With the long echo times used in PRESS, there is a better
visualization of metabolites with longer relaxation times. Many
of the metabolites depicted by stimulated echo technique are not
seen on point resolved spectroscopy, but PRESS is less
susceptible to motion, diffusion, and quantum effects and has a
better SNR than stimulated echo acquisition mode (STEAM).
 |
 |
|
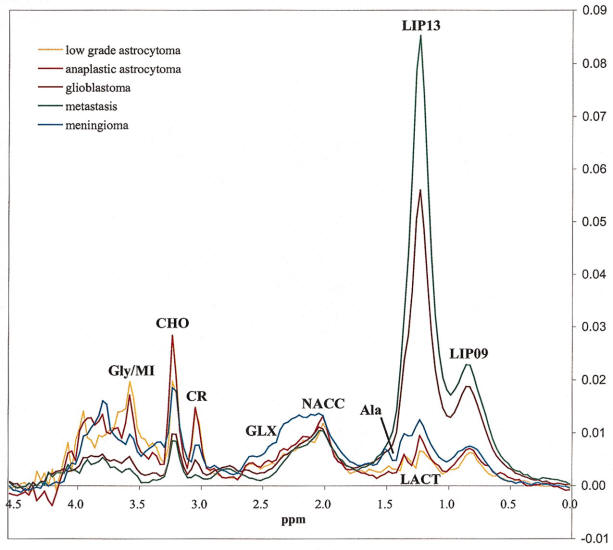
Long TE 136 msec spectroscopy |
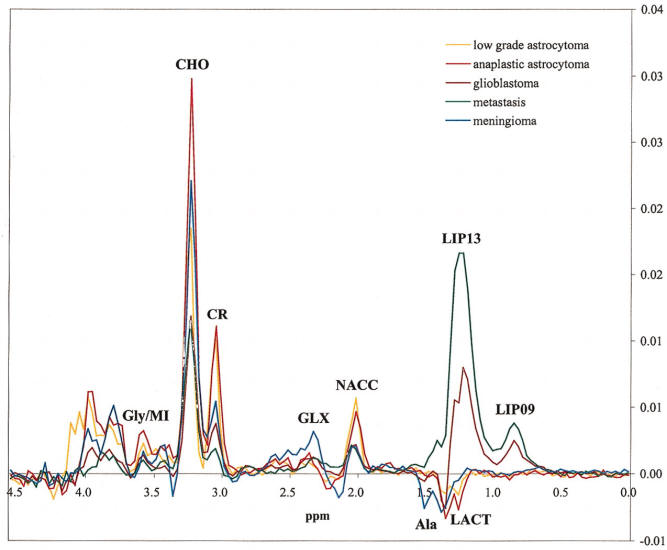
Short TE 30 msec spectroscopy |
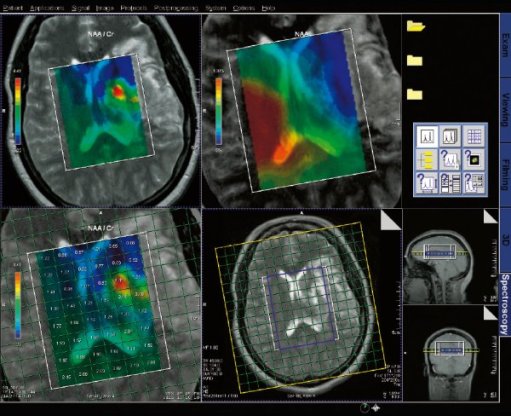
Spectroscopy Evaluation
Integrated software package with extensive graphical display
functionality to evaluate and post-process spectroscopy
acquisition data.
Features
Display of CSI data as colored metabolite images or spectral
overview maps, overlaid on anatomical image
Export of spectroscopy data to a user-accessible file format
Relative quantification of spectra, compilation of the data to
result table
Automated peak normalization tissue, water or reference
New dedicated SVS breast evaluation protocols
|
 |
|
Spectroscopy evaluation task card |
Step by step for basic functionality (SVS)
1. Load the SVS data set into the Spectroscopy application.
The metabolite spectrum will automatically be shown in the first
segment.
2. Select single data set mode. This will allow for creation of
tables in the empty segments.
3. View the localizer. Double clicking on a localizer image puts
this image in the large segment.
4. Activate an empty segment and right click select results
table. This table will give you a ratio of metabolite integrals,
where you select the denominator.
5. Save the results. Activate a segment and select save as,
choose "selected results". This can be viewed or sent to PACs
from the patient browser.
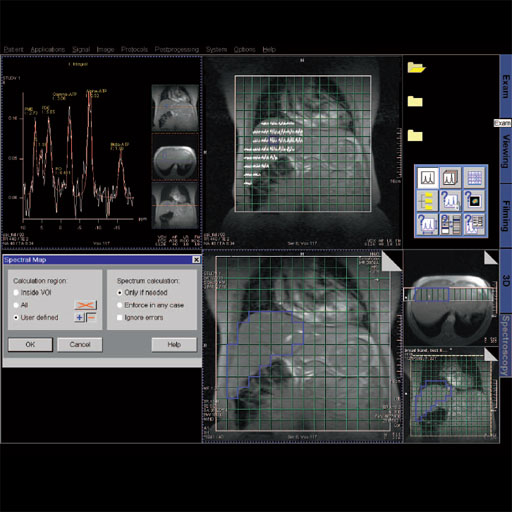
Step by step for basic functionality (CSI) 1. Load
the CSI data set into the Spectroscopy Application.
2. Select Spectral Map on an empty segment. This will provide
spectral graphs for all voxel within the Vol.
3. Zoom and pan the image to the desired size.
4. Select the last empty segment and select metabolite map.
Create a ratio map to show levels of a desired metabolite
compared to another.
5. Zoom and pan this image to the desired size.
6. Select the Save Data icon, Selected Results, to save maps.
7. Individual voxel graphs can be viewed by selecting a voxel on
the localizer
Single Voxel Spectroscopy
Software package with sequences and protocols
for single voxel proton spectroscopy.
Features
Streamlined for easy push-button operation
Matrix Spectroscopy – phase-coherent signal
combination from several coil elements for
maximum SNR based on the head matrix coil
Spectral suppression (user definable parameter)
to avoid lipid superposition in order to
reliably detect e.g. choline in the breast
Up to 8 regional saturation (RSat) bands for
outer volume suppression can be defined by the
user
Physiological triggering (ECG, pulse,
respiratory or external trigger) in order to
avoid e.g. CSF pulsation artifacts
| |
 |
| |
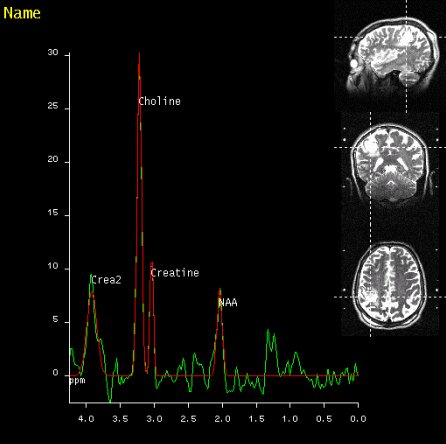
SVS shows increased Choline signal
in the lesion of the right parietal
lobe, proving malignancy |
Step by step:
1. Run localizers, and open the svs_se_135
sequence. This is found in the exam explorer,
under; Spectroscopy, Head, SVS.
2. Position the VOI on one image and go to
scroll, nearest. This will align the VOI in
plane for all orientations.
3. Notice that the VOI has solid borders. This
means that the VOI intersects in all three
planes.
4. Select "Reference Lines". This will show
where the slices intersect the VOI.
5. Apply the sequence.
6. Notice in this example that the sequence name
has been changed from the factory default
nomenclature.
This will disable the automatic postprocessing
protocol when loaded into Spectroscopy
Evaluation. To correct this ensure the scanned
sequence stays the same as the factory default.
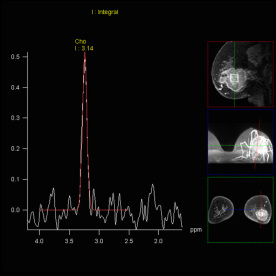
GRACE: GeneRAlized breast speCtroscopy Exam- Choline
level follow up to evaluate Ca breast: (GeneRAlized breast
speCtroscopy Exam) SVS technique (spin echo sequence) optimized for breast
spectroscopy. The technique contains a special spectral lipid suppression
pulse (user definable) for lipid signal reduction. Siemens
unique water reference detection to visualize the normalized
choline ratio. Online frequency shift correction for reduction of breathing
related artifacts, Inline implementation – no additional
user interaction is required. Clinical applications: • Differentiating benign from malignant breast lesions • Predicting clinical response to neoadjuvant chemotherapy
in an early stage (24hours after receiving the first dose)
| |
 |
3D CSI (Chemical Shift Imaging):
Integrated multivoxel spectroscopy software package with
sequences and protocols for 3D Chemical Shift Imaging (CSI).
Features
Matrix Spectroscopy – phase-coherent signal combination from
several coil elements for maximum SNR with configurable
prescan-based normalization for optimal homogeneity
3D Chemical Shift Imaging
Hybrid CSI with combined Volume selection and Field of View
(FoV) encoding
Short TEs available (30 ms for SE, 20 ms for STEAM)
Automized shimming of the higher order shimming channels for
optimal homogeneity of the larger CSI volumes
Weighted acquisition, leading to a reduced examination time
compared to full k-space coverage while keeping SNR and
spatial resolution
Outer Volume Suppression
Spectral Suppression
Protocols for prostate spectroscopy
Clinical Applications
Prostate Spectroscopy for diagnosis, localization of
prostate cancer
Improved spatial localization of metabolic changes in biopsy
or radiotherapy planning
 |
 |
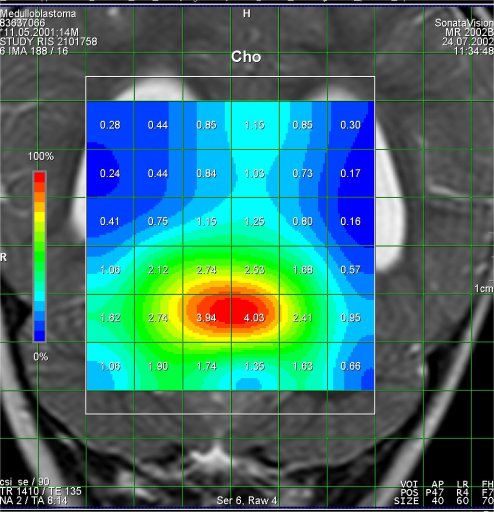 |
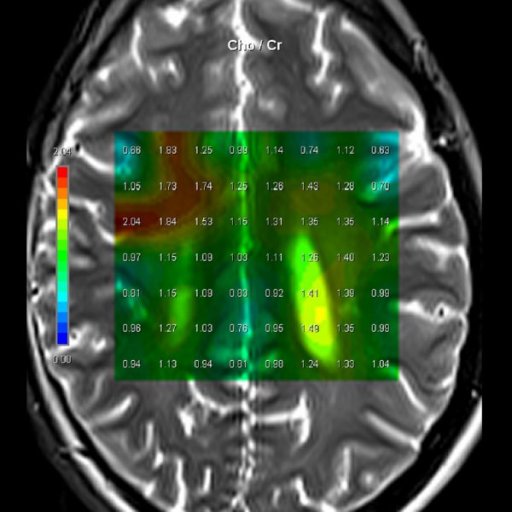
| Cho/Cr ratio map
generated from 3D CSI measurement |
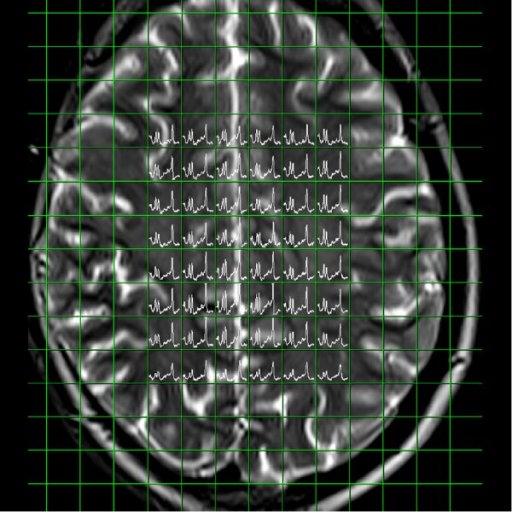
Spectral nap
generated from 3D CSI measurement |
Increased Cho-signal
in a medulloblastoma case |
Step by step:
1. Perform imaging in all three planes to
include the entire brain. Open the csi 3D se 135
sequence. Located in the exam explorer in the
Spectroscopy, CSI, head region.
2. Scroll thru the transversal images for area
of interest.
3. Copy image position. Right click on the
selected transverse image, from the menu select
copy image position.
4. Go to the scroll drop down menu and select
scroll nearest. This will align the 3D VOI in
all three orientations.
5. Rotate the VOI inplane on the transversal
image to cover the area of interest.
6. Open toolbar, and and select create sat
bands. Draw saturation bands around all sides of
the 3D VOI to remove lipid signal from
calvarium.
7. Select fully excited VOI, on the Geometry
card.
Apply the sequence.
31 P Spectroscopy: Optimized for liver and heart
applications.
Integrated package with RF coil, sequences and protocols for
31P spectroscopy.
Offering the same level of user friendliness and automation
as 1H spectroscopy.
1H/31P transmit/ receive Heart Liver coil for 31P
spectroscopy
Short TE CSI sequence and protocols optimized for heart and
liver applications
NOE (Nuclear Overhauser Effect) and 1H decoupling available
ECG triggering available
Weighted acquisition available
|
|
Prostate
Package #T+D |
|
The prostate spectroscopy package is an comprehensive
software package which bundles:
- Single Voxel Spectroscopy
- 2D Chemical shift Imaging
- 3D Chemical Shift Imaging
- Spectroscopy Evaluation syngo
- syngo Tissue 4D Evaluation
Sequences and protocols for proton spectroscopy, 2D and 3D
proton chemical shift imaging (2D CSI and 3D CSI) to examine
metabolic changes in the prostate are included. Furthermore
included is the comprehensive Spectroscopy evaluation software
which enables fast evaluation of spectroscopy data on the syngo
Acquisition Workplace.
Tissue 4D is an application for visualizing and post-processing
dynamic contrast-enhanced 3D datasets.
Tissue 4D provides two evaluation options:
- Standard curve evaluation
- Curve evaluation according to a pharmacokinetic model.
The spectroscopy evaluation software is fully integrated in
syngo MR.
Evaluation protocols adapted to the scan protocols carry out a
complete and automatic evaluation of the measured data.
Optimized protocols for 3D CSI in the prostate are included.
The following functions are included:
- Subsequent water suppression with optional phase correction
- Apodization
- Zero filling
- Fourier transformation
- Base line correction
- Automatic or manual phase correction
- Curve fitting and peak labeling
- Summaries in tabular form of the essential results specifying
the metabolites, their position, integrals and signal ratios in
relation to a selectable reference.
Tissue 4D provides the tissue visualization features:
- 4D visualization (3D and over time)
- Color display of parametric cards (Ktrans, Kep, Ve, Vp, iAUC)
- Additional visualization of 2D or 3D morphological dataset
Post-processing features:
- Elastic 3D motion correction
- Fully automatic calculation of subtracted images
Standard curve evaluation:
- Calculation and display of enrichment curves
Pharmacokinetic model:
- Pharmacokinetic calculation on a pixel-by-pixel basis using a
2-compartment model
- Calculation is based on the Toft model. Various model
functions are available.
- Manual segmentation and calculation on the result images.
The following result images can be saved as DICOM images:
- 3D motion-corrected, dynamic images
- Colored images
- Possibility for exporting results in the relevant layout
format.
|
|
Applications
of Spectroscopy |
|
In (1H) Magnetic Resonance Spectroscopy each proton can be
visualized at a specific chemical shift (peak position along
x-axis) depending on its chemical environment. This chemical
shift is dictated by neighboring protons within the molecule.
Therefore, metabolites can be characterized by their unique set
of 1H chemical shifts. The metabolites that MRS probes for have
known (1H) chemical shifts that have previously been identified
in NMR spectra. These metabolites include:
1.) N-acetyl Aspartate (NAA): with its major resonance peak at
2.02ppm, is a neuronal marker and decrease in levels of NAA indicate loss or damage to
neuronal tissue, which results from many types of insults to the
brain. Its presence in normal conditions indicates neuronal and
axonal integrity.
2.) Choline: with its major peak at 3.2ppm, choline is known to
be associated with membrane turnover, or increase in cell
division. Increased choline indicates increase in cell
production or membrane breakdown, which can suggest
demyelination or presence of malignant tumors or inflammatory
processes.
3.) Creatine & phosphocreatine: with its major peak at 3.0ppm,
creatine marks metabolism of brain energy. Gradual loss of
creatine in conjunction with other major metabolites indicates
tissue death or major cell death resulting from disease, injury
or lack of blood supply. Increase in creatine concentration
could be a response to cerebral trauma. Absence of creatine may
be indicative of a rare congenital disease.
4.) Lipids: with their major aliphatic peaks located in the
0.9-1.5ppm range, increase in lipids is seen is also indicative
of necrosis. These spectra are easily contaminated, as lipids
are not only present in the brain, but also in other biological
tissue such as the fat in the scalp and area between the scalp
and skull.
5.) Lactate: is a market of oxygen deficiency, reveals itself as a doublet (two symmetric peaks in
one) at 1.33ppm. Normally lactate is not visible, for its
concentration is lower that the detection limit of MRS, however
presence of this peak indicates glycolysis has been initiated in
an oxygen deficient environment. Several causes of this include
ischemia, hypoxia, mitochondrial disorders, and some types of
tumors.
6.) Myo-inositol: with its major peak at 3.56ppm, an increase in
Myo-inositol has been seen in granulation and gliosis and patients with Alzheimer’s,
dementia, and HIV patients.
7.) Glutamate and Glutamine: these amino acids are marked by a
series of resonance peaks between 2.2 and 2.4ppm.
Hyperammonemia, hepatic encephalopathy are two major conditions
that result in elevated levels of glutamine and glutamate. MRS,
used in conjunction with MRI or some other imaging technique,
can be used to detect changes in the concentrations of these
metabolites, or significantly abnormal concentrations of these
metabolites.
|
|
Indication for Spectroscopy |
|
Differential diagnosis of low-grade and high=grade tumors.
Monitoring under radio-chemotherapy.
differentiation of recurrent tumor from secondary necrosis due
to therapy.
|
|
|