|
|
Information box |
The main purpose of this site is to extend the
intraoperative monitoring to include the neurophysiologic
parameters with intraoperative navigation guided with Skyra 3
tesla MRI and other radiologic facilities to merge the
morphologic and histochemical data in concordance with the
functional data.
 CNS Clinic
Located in Jordan Amman near Al-Shmaisani hospital, where all
ambulatory activity is going on.
Contact: Tel: +96265677695, +96265677694.
Skyra running
A magnetom Skyra 3 tesla MRI with all clinical applications
started to run in our hospital in 28-October-2013.
Shmaisani hospital
The hospital where the project is located and running diagnostic
and surgical activity. |
|
 |
|
|
By the late 1970s, somatosensory evoked
potentials (SEPs) became routinely used to intraoperatively
assess the functional integrity of the somatosensory system in
the spinal cord during surgical correction for scoliosis. The
same SEPs data were also routinely extrapolated to assess the
functional integrity of the upper motor neuron tracts; however,
as data mounted, this approach proved unreliable:
(a) it provided false results when SEPs were found to be present
despite postoperative motor deficits;
(b) it provided unreliable (low-quality) or unmonitorable
(complete absence) SEPs in patients in whom certain pathologies
affected the somatosensory system; and
(c) because dorsal myelotomy often destroyed the dorsal column’s
integrity in patients undergoing surgery for intramedullary
spinal cord tumors, the ability to monitor SEPs immediately
nullifies.
Because of these difficulties, ION was forced to search for more
reliable methods to assess the motor system’s functional
integrity. Initial attempts to monitor motor tracts in the
spinal cord were made and focused on two neurophysiological
techniques: spinal-cord-to-spinal- cord recording, and
spinal-cord-to-muscle/peripheral-nerve recording.
 |
Spinal cord to
spinal cord |
 |
This technique
operates with nonselective electrical stimulation of the
spinal cord and with nonselective recordings of elicited
potentials from the spinal cord. It is used to record
signals from the spinal cord regardless of the direction
of propagation of the action potentials (either
ascending, descending, or ortho/antidromic). The type of
action potential recorded depends on the position of the
stimulating and recording electrodes and the direction
of the traveling waves through the spinal cord with
regards to the natural direction of the conducting
pathways.
The evoked potentials recorded from the spinal cord
using this technique are the electrical sum of activity
from multiple pathways. Because of the different
conduction properties of the various spinal cord
pathways, the recorded potentials can show two
distinctive wave morphologies. It has been speculated
that one of these waves represents transmission in the
dorsal columns (DCs) and the other by the corticospinal
tract (CT). Clinical testing on a large number of
patients with different and relevant pathologies has not
been done to confirm this hypothesis.
This method can evaluate the integrity of ascending and
descending, and probably propriospinal pathways, within
the spinal cord. However, specific information about the
DC or CT cannot be obtained with this method. Critical
reports could not confirm the value of the spinal cord
to spinal cord technique in monitoring motor pathways
during surgery for intramedullary spinal cord tumors.
|
|
Spinal cord to
peripheral nerve |
|
This technique
operates with nonselective stimulation of the spinal
cord and selective recordings from the peripheral nerves
or muscles. Recordings from the muscle and peripheral
nerves presume that after electrical stimulation of the
spinal cord, α-motoneurons are activated only by the CT
tract. Therefore, compound muscle action potentials
(CMAPs) in the limb muscles or electrical activity in
the peripheral nerves should be generated by CT
stimulation. Unfortunately, α-motoneurons can also be
activated by any of the multiple descending tracts
within the spinal cord after diffuse electrical
stimulation of the spinal cord and/or by antidromically
activated dorsal columns and their segmental branches
that mediate the H reflex. Electrical activity recorded
from mixed peripheral nerves is a combination of
α-motoneuron discharges initiated by the CT and other
descending tracts. Because the sensory component of
mixed peripheral nerves is a physical continuation of
the dorsal columns, part of the electrical activity
recorded from mixed peripheral nerves after stimulation
of the spinal cord arises from the antidromically
activated dorsal columns that convey traveling waves to
the peripheral nerves. Collision studies have challenged
the widely accepted presumption that potentials recorded
from peripheral nerves in the lower extremities after
stimulation of the spinal cord are generated by the CT.
Therefore, there is convincing evidence that selective
recording of the electrical activity from peripheral
nerves elicited by electrical stimulation of the spinal
cord does not arise from the CT. Additional evidence
concerning the inaccuracy of monitoring the motor
pathways through potentials recorded from peripheral
nerves is provided by observations of resulting
paraplegia in spite of preservation of these potentials.
It is fair to say that both of the techniques described
can grossly monitor the functional integrity of multiple
pathways inside the spinal cord without being specific
for any of them. In other words, these methods can
indicate that certain lesions to the spinal cord have
occurred, but they lack the ability to provide specific
information as to which of the spinal cord pathways has
been damaged. This methodology may be useful in
orthopedic surgical procedures and other surgeries where
lesioning of the nervous tissue within the spinal cord
is diffuse in nature and where all pathways are usually
affected. An exception to this phenomenon involves
vascular lesions of the spinal cord where selective
lesioning of the anterolateral columns can occur.
Unfortunately, this nonselective evaluation of multiple
pathways is not sufficient during surgery of the spinal
cord, during which the DCs can be independently damaged
from the anterior and lateral columns. Furthermore,
these two techniques cannot evaluate the functional
integrity of the CT from the motor cortex to the upper
cervical spinal cord. Therefore, supratentorial,
brainstem, foramen magnum, and upper cervical spinal
cord surgeries cannot be monitored using these
techniques. This is also the case in procedures
involving the clipping of an intracerebral aneurysm,
where the perforating branches for the CT tract in the
internal capsula can be selectively damaged while
leaving the lemniscal pathways intact. This results in a
so-called pure motor hemiplegia (i.e., the patient is
postoperatively hemiplegic while the sensory system is
intact and SEPs are present). Since it requires the
motor cortex to be surgically exposed, Penfield’s
technique may not be used for monitoring motor tracts
within the spinal cord.
|
|
Transcranial
Electrical Stimulation |
|
High-voltage current
applied over the skull could penetrate to the brain and
activate the motor cortex and the CT. Although they
produced discomfort, these methods of transcranial
electrical stimulation (TES) became an additional tool
used to diagnose upper motoneuron lesions in awake
patients. Two methodologies for monitoring the CT
intraoperatively are available, the single-pulse
stimulation technique and the multipulse stimulation
technique.
|
|
Single Pulse
Stimulation Technique |
|
A single-pulse
stimulating technique involves a single electrical
stimulus applied transcranially or over the exposed
motor cortex while the descending volley of the CT is
recorded over the spinal cord as a direct wave (D wave).
|
|
Multipulse
Stimulation Technique |
|
A multipulse
stimulating technique involves a short train of five to
seven electrical stimuli applied transcranially or over
the exposed motor cortex while muscle motor-evoked
potentials (MEPs) from limb muscles in the form of CMAPs
are recorded (Fig.1). (This latter technique differs
essentially from the Penfield technique in that it calls
for only five to seven stimuli with a stimulating rate
of up to 2 Hz. Penfield’s technique calls for continuous
stimulation over a period of a few seconds with a
frequency of stimulation of 50–60 Hz, and only in the
cases when the motor cortex is surgically exposed.
Furthermore, at such frequencies and train durations,
seizures are easily induced.)

|
|
Figure-1: (A) Schematic illustration
of electrode positions for transcranial electrical
stimulation of the motor cortex according to the
International 10–20 EEG system. The site labeled “6 cm”
is 6 cm anterior to CZ. (B) Illustration of grid
electrode overlying the motor and sensory cortexes. (C)
Schematic diagram of the positions of the catheter
electrodes (each with three recording cylinders) placed
cranial to the tumor (control electrode) and caudal to
the tumor to monitor the descending signal after it
passes through the site of surgery (left). In the middle
are D and I waves recorded rostral and caudal to the
tumor site. On the right is depicted the placement of an
epidural electrode through a flavectomy/flavotomy when
the spinal cord is not exposed. (D) Recording of muscle
motor evoked potentials from the thenar and tibialis
anterior muscles after being elicited with multipulse
stimuli applied either transcranially or over the
exposed motor cortex. |
Figure-2 D and I waves recorded after a single
electrical stimulus delivered transcranially (CZ anode/6
cm anterior cathode). When the intensity of the stimulus
is increased, electrical current activates the CT deeper
within the brain and the latency of the D wave becomes
shorter. As current becomes stronger, more I waves are
induced (100% corresponds to 750 volts of stimulator
output). |
Figure-3 Transcranial electrical stimulation over the C4
anode/C3 cathode with recordings of the D wave over the
C6–C7 segment (above) and the T7–T8 segment of the
spinal cord (below). Stimulus intensity was 35 and 40
mA, respectively. Stronger stimuli elicit the D wave
over the thoracic spinal cord, while a weaker stimulus
(35 mA) elicits the D wave only over the cervical spinal
cord. |
|
|
Scalp
Electrode Placement during TES |
|
The electrode
placement on the skull is based on the international
10–20 EEG system. Note that, instead of CZ, the CZ
electrode is placed 1 cm behind the typical CZ point.
For transcranial stimulation, cork screw–like electrodes
are preferable because of their secure placement and low
impedance (usually 1 KΩ).
Alternatively, an EEG needle electrode may be used. It
is not recommended to use the EEG cup electrodes fixed
with collodium since they are impractical and their
placement is time-consuming. The only exception is for
young children in whom the fontanel still exists. Since
the cork screw–like electrodes could penetrate the
fontanel during placement, the use of EEG cup electrodes
is suggested.
The skull presents a barrier of high impedance to the
electrode current applied transcranially; therefore, we
cannot completely control the spread of electrical
current when it is applied. For this reason, various
combinations of electrode montages may need to be
explored to obtain an optimal response.
The standard montage is C3/C4 for eliciting MEPs in the
upper extremities and C1/C2 for eliciting MEPs in the
lower extremities. With sufficient intensity of
stimulation at C1/C2, MEPs are preferentially elicited
in the right limb muscles while stimulation at C2/C1
elicits MEPs in the left limb muscles.
With stronger electrical stimulation, the current will
penetrate the brain more deeply, stimulating the CT at a
different depth from the motor cortex (Fig-2). On the
basis of measurements of the D wave latency, it has been
postulated that there are three favorable points that
are susceptible to depolarization of the CT:
cortex/subcortex (weak electrical stimulation), internal
capsula (moderate electrical stimulation), and
brainstem/foramen magnum (strong electrical
stimulation). Selectivity of stimulation is possible at
the level of the cortex (subcortex). Therefore, only the
application of relatively weak electrical stimuli to the
cortex is selective, and it activates only a small
portion of the CT fibers (e.g., activating only one
extremity) or only one CT. It is important to remember
that during electrical stimulation of the motor cortex,
the anode is preferentially the stimulating electrode.
With increasing intensity of the current, the cathode
becomes the stimulating electrode as well.
As an example, stimulation with the C3+/C4− will
selectively activate muscles of the right arm. When
stimulation intensity is increased, the cathode (C4−)
becomes the stimulating electrode as well, resulting in
the stimulation of the left arm. Finally, when current
intensity becomes strong enough to penetrate to the
internal capsule more caudally, all four extremity
muscles can be activated. For anatomical reasons (deep
position of the leg motor area in the interhemispheric
fissure), more intense current is usually needed to
obtain MEPs in the lower extremities. It is especially
difficult to obtain them separately without also
activating the upper extremities, but it can be done in
certain patients, especially when using the CZ/6 cm in
front montage (see Fig-1).
By their anatomical location, recording electrodes in
the limb muscles can indicate which fibers of the CT are
activated predominantly (left or right, fibers for upper
or lower extremities). If one would like to activate
left and right CT simultaneously to obtain D wave
recordings, weak electrical stimulation should be
avoided and a moderate intensity should be used. In
Fig-3, it is obvious that weak electrical stimulation
activates fibers of the CT for the left upper
extremities only. This can result in activation of only
one CT while not affecting the other CT. Therefore, the
intensity of electrical stimulation for eliciting a D
wave should be determined by simultaneous recordings of
MEPs from limb muscles (indicating which fibers of the
CT have been predominantly activated), or only moderate
intensities of electrical current for eliciting D waves
should be used. The moderate intensity of electrical
current will activate both CTs at the level of the
internal capsule. If MEP waves have not been
simultaneously recorded with D waves, the following
guidelines should be followed: increase the intensity of
the stimulation until D waves do not increase in
amplitude (Fig-2, the third trace from the top). This is
a sign that most of the fast conducting neurons of CT
from the left and right CT have been activated.
The neurophysiological mechanism for eliciting MEPs by
stimulating the motor cortex in patients under the
influence of anesthetics is different from the mechanism
in the awake subject. In the latter, electrical current
stimulates the body of the motor neuron transynaptically
over the chain of vertically oriented excitatory
neurons, resulting in I waves (indirect activation of
the motoneurons). At the same time, electrical current
activates axons of the cortical motoneurons, directly
generating D waves. In anesthetized patients,
anesthetics block the synapses of the vertically
oriented excitatory chains of neurons terminating on the
cortical motoneuron’s body. Therefore, only the D wave
is generated after electrical stimulation of the motor
cortex. Patients with idiopathic scoliosis are an
exception. In this group, abundant I waves can be
recorded). This is one of the neurogenic markers of the
disease present in these patients. Furthermore, it has
been shown that a frontally oriented cathode
preferentially generates I waves because at this
stimulating setting corticocortical projections of
vertically oriented interneurons are optimally
activated. With the cathode in the lateral position,
this is not the case (Fig-4).
|
|
| Figure-4 Upper
thoracic epidural recordings of D and I waves in a
14-year-old female during surgery for a low cervical
intramedullary tumor. The upper trace was obtained
after transcranial electrical stimulation over C1
(anode) and C2 (cathode) using 140 mA stimulus
intensity and a stimulus duration of 500 μs. The
lower trace was obtained after anodic stimulation at
CZ and cathodal stimulation at 6 cm anterior to CZ,
using the same stimulus duration but at 200 mA. Note
the appearance of the D and I waves with this
electrode arrangement. (An upward deflection is
negative.) |
Figure-5 Two traces with a D wave
recorded epidurally at the lower cervical spinal
cord after percutaneous placement of the epidural
electrode in a patient with a brain tumor. High
impedance results in a large artifact (lower trace)
which has been reduced (upper trace) after injection
of saline into the epidural space. |
|
|
D-wave
Recording Technique |
|
Practically any type
of catheter-type electrode designed for electrical
stimulation of the spinal cord epidurally can be used
for recording D and I waves. The electrode has three
platinum-iridium recording cylinders 3 mm in length, 1.3
mm in diameter, and 18 mm apart, with recording surfaces
of approximately 12.3 mm2. The electrode is
semi-rigid, a property that facilitates its placement
either percutaneously or through flavotomy. Furthermore,
some electrodes consists of a double lumen with two
openings at the tip of the electrode to allow the
injection of saline to flush the recording contact
surfaces and reduce impedance. This is an important
detail in the case of bad electrode contact if the
electrode is placed percutaneously in the epidural space
(where it can face a high impedance). Once the electrode
is in place, it is very difficult to reposition it.
Thus an injection of saline through the outer lumen is a
method of rectifying the high-impedance problem (Fig-5).
When the electrode is placed after laminectomy, problems
with impedance and positioning of the electrode are
easier to solve because the surgeons are able to
reposition the lead. Most epidural electrodes are
disposable. If one uses a nondisposable type, extreme
care should be taken to ensure that the electrode is
clean before sterilization and thus has improved
electrical properties. To clean the electrode, you can
immerse the electrode tip in saline and pass a 9 V DC
current (regardless of polarity) through it until a
bubble of gas cleans the contact surface for a period of
a few minutes, or you can use an ultrasound cleaner by
submersing the electrode in the cleaner for 5 minutes.
Both techniques will remove any film or biological
material remaining on the electrode from the contact
surfaces and will decrease their impedance. This
maneuver will diminish the stimulus artifact, which
usually appears when contact surfaces have high
impedance. Because of the short latency of the D wave, a
large stimulus artifact in an uncleaned electrode can
pose an insurmountable obstacle for D wave recording.
 Percutaneous Placement
of Catheter Electrode
Percutaneous Placement
of Catheter Electrode
This procedure is used usually
to monitor the CT during brainstem and supratentorial surgeries
where there is high risk of potential damage. Today, because of
the increasing popularity of MEPs monitoring during procedures
involving the spinal cord and brainstem, the demand
(indications) for percutaneous placement of this type of
electrode has diminished. A 14-gauge, thin-wall Touhy needle is
used for introducing the electrode into the epidural space
percutaneously. Following percutaneous electrode placement, care
must be taken not to withdraw the electrode while the Touhy
needle is in place. Otherwise, the sharp edge of the needle
could shred the wall of the electrode. The optimal position for
penetrating the epidural space with the Touhy needle is the
upper thoracic (T1–T2) epidural space. With the needle in this
region, the catheter electrode can be gently pushed up to the
level of the lower cervical spinal cord. With this electrode
placement we can monitor the CT for both the upper and lower
extremities by recording D waves after selective stimulation of
the motor cortex. Appropriate electrode placement can be
confirmed either by x-ray or by recording epidural SEPs from the
same electrode after stimulation of the median or ulnar nerves.
Minimal complications from the placement of the electrode occurs
(e.g., bleeding, infection, or puncture of the spinal cord).
This method requires skills that the anesthesiologist practiced
in the epidural injection of anesthetics would typically have.
Placement of Electrode
after Laminectomy/Laminotomy or Flavectomy/Flavotomy
This technique is regularly
used for all procedures that require CT monitoring when a
laminectomy is performed. These procedures include surgery for
the removal of spinal cord tumors and different surgical
interventions on the spinal cord. The surgeon places two
catheter electrodes in the epi- or subdural space at the rostral
and caudal edge of the laminectomy. The rostral electrode is the
control electrode for nonsurgically induced changes in the D
wave, while the caudal one monitors the surgically induced
changes to the CT (see Fig-1).
Massive dural adhesions, usually from previous surgery or after
spinal cord radiation, can prevent the placement of the catheter
electrode. Also, placement below the T10 bony level cannot
record a D wave of sufficient amplitude because of lack of
sufficient CT fibers. The control (rostral) electrode cannot be
placed in cases of high cervical spinal cord pathology because
of the lack of space. The amplitude of the D wave recorded over
the cervical spinal cord could be 60 μV or more, while over
thoracic segments it may be only 10 μV. With a stimulating rate
of 2 Hz, it takes two to four averaged responses to get a
reliable D wave. This results in an update every second.
Unfortunately, the maximal stimulating rate from commercially
available TES stimulators is 1 stimulus per second.
In surgical procedures in which the spine is exposed but a
laminectomy is not performed (e.g., surgical corrections of
scoliosis or dorsal approach to spine stabilization), the
catheter electrode may be inserted through a
flavotomy/flavectomy.
|
|
FACTORS
INFLUENCING D AND I WAVE RECORDINGS |
|
D waves represent a
neurogram of the CT which is not significantly
influenced by nonsurgically induced factors. Stimulation
of the CT takes place intracranially distal to the
cortical motoneuron body, while recording is done caudal
to the surgical site but above the synapses of the CT at
the α-motoneuron. Since no synapses are involved between
the stimulating site and the recording site, the D wave
is very stable and reliable. Therefore, we consider D
wave recordings to be the “gold standard” for measuring
the functional integrity of the CT.
Still, there exists a few nonsurgically induced changes
that will affect the D wave. Being able to correctly
recognize them is essential to giving the surgeon
appropriate information. If the exposed spinal cord is
cooled, either by cold irrigation with saline or low
operating room temperature, the latency of the D wave
will be temporarily prolonged (Fig-6). Sometimes during
stimulation, even with a single stimulus, the epidural
electrode can pick up the paraspinal muscle artifact.
This would affect the I wave, but not the D wave,
parameters (see Fig-7). If this phenomenon occurs, it is
more frequent during cervical than thoracolumbar
catheter placement.
Volatile anesthetics mostly, do not change the
parameters of the D wave by influence on the membrane
properties of the CT. To demonstrate this, as isoflurane
concentration increases (e.g., >2%), the latency of the
D wave gets prolonged while the amplitude diminishes
(see Fig-8). However, this can be easily corrected by
increasing the intensity of the current. Therefore, the
mechanism by which isoflurane influences the parameters
of the D wave is vasodilatation of the cortical blood
vessels. Because of the vasodilatation, current between
the stimulating electrodes shunts and activates the CT
more superficially, resulting in longer latencies of the
D wave. The smaller amplitude of the D wave results from
fewer fibers of the CT being activated if current flows
superficially (Fig-9). A prolongation of the latency and
a diminished amplitude of the D wave occur only if the
CT is activated transcranially. In contrast, this
phenomenon is not present when the motor cortex is
stimulated directly through a grid electrode with a
short distance between the electrodes. All of the above
observations provide evidence that changes in the D wave
are due to mechanisms other than influence on the CT
axon membranes.
|
|
|
Figure-6 D waves recorded over the lower cervical spinal
cord in a patient with an upper cervical intramedullary
spinal cord tumor, after stimulation with CZ anode/6 cm
anterior cathode. Temporary cooling of the exposed
spinal cord results in delayed latency of the D and I
waves. After warming of the spinal cord, the latency of
the D and I waves returned to the previous values. |
Figure-7 Epidurally recorded D and I waves over the
cervical spinal cord showing a muscle artifact. After
administration of the muscle relaxant, the muscle
artifact disappears. The muscle artifact affects the I
wave, but not the D wave, recordings. S = beginning of
transcranially applied stimulus. |
Figure-8 Transcranial electrical stimulation (CZ anode/6
cm anterior cathode) and direct electrical stimulation
of the exposed motor leg area with recording of the D
wave over the lower thoracic spinal cord in two
different patients. Identical concentrations of
isoflurane showed a prominent effect on the amplitude
and latency of the D wave (50% decrement of amplitude
and 0.5 ms prolonged latency after end tidal
concentration of 2% isoflurane). This effect is only
evident
when transcranial electrical stimulation is used. A
minimal effect of isoflurane on D wave parameters was
observed when electrical stimulation was applied to the
exposed cortex. |
Figure-9 To the left, current flow is represented
schematically before (white line) and after (grey line)
administration of isoflurane. Because of the
vasodilatatory effects of isoflurane on the cortical
blood vessels, the current between the two stimulating
electrodes is shunted, flowing through the brain more
superficially. This results in a prolonged latency and
smaller amplitude of the D wave when compared to a D
wave elicited with the same intensity of current without
isoflurane
(6.0 ms vs. 6.3 ms, respectively; to the right). At the
same time, the disappearance of the I wave can be
observed under the influence of isoflurane. |
|
|
FACTORS
LEADING TO THE DESYNCHRONIZATION OF THE D WAVE |
|
In certain patients
with spinal cord tumors (usually involving a few
segments) the D wave is not recordable at the beginning
of surgery. At the same time, muscle MEPs are
recordable, even in patients that may not necessarily
have a major motor deficit (Fig-10). The temporal
summation of the desynchronized D waves occurs at the
segmental level. The same phenomenon is present in
patients who undergo radiation of the spinal cord. This
is a result of a desynchronization in conduction of the
CT axon. In other words, fast fibers of the CT conduct D
waves with different speeds over the site of the lesion
or irradiation. Therefore, desynchronized D waves cannot
be easily demonstrated caudal to the lesion site with
the present methodology. There are different grades of
desynchronization, which will be seen as low-amplitude
and widebase D waves (Fig-10A). A higher degree of
desynchronization is represented by a nonrecordable D
wave (Fig-10B).
Patients who do not have a recordable D wave at the
beginning of surgery are challenging for the monitoring
team because they represent a high-risk group of
patients for injury to the CT. With the present
methodology, you can only monitor them by recording MEPs
from limb muscles. Because of the possibility that
transient paraplegia may occur, this is not an ideal
monitoring tool. When muscle MEPs disappear during
surgery in the patients who do not have a recordable D
wave at baseline, it is not possible to distinguish
transient from permanent motor deficit intraoperatively.
|
|
| Figure-10 (A)
Recording of a D wave cranially (upper trace) and
caudally (lower trace) to the intramedullary spinal
cord tumor. Note the well-synchronized D wave
cranially, in contrast to the desynchronized D wave
caudal to the tumor. (B) Very small epidurally
recorded MEPs caudal to a high cervical
intramedullary tumor (due to extreme
desynchronization), despite large muscle MEPs
recorded from a small hand muscle elicited after a
short train of six stimuli were present (to the
right). |
|
|
SELECTION OF
OPTIMAL MUSCLES IN UPPER AND LOWER EXTREMITIES
FOR MEP RECORDINGS |
|
The selection of
appropriate muscles to record from is an important issue
in the monitoring of MEPs. In certain patients who have
deep paresis, not choosing the optimal muscles can
result in “nonmonitorable” patients. The small hand
muscle (e.g., abductor pollicis brevis, or APB) is one
of the optimal muscles to monitor the CT for the upper
extremities. It has been shown that a good alternative
is the long forearm flexors, or even the forearm
extensors. The spinal motoneurons for these muscle
groups have rich CT innervation and are therefore
suitable for monitoring the functional integrity of the
CT. This is not the case with the proximal muscle of the
arm or of the shoulder (biceps, triceps, or deltoid
muscles).
For the lower extremities, abductor hallucis brevis
(AHB) is the optimal muscle because of its dominant CT
innervation. In animal experiments, it has been shown
that after CT stimulation the highest amplitude of the
excitatory postsynaptic potential (EPSP) has been found
in the α-motoneuron pools for the lower extremities in
the small and long flexors of the foot. An alternative
to this muscle is the tibialis anterior muscle (TA). The
standard electrode montage for recording MEPs in the
upper and lower extremities are the AHB and TA for the
lower extremities and the ABP for the upper extremities.
|
|
MECHANISMS FOR
ELICITING MEPS USING A MULTIPULSE STIMULATION
TECHNIQUE |
|
Understanding the
mechanism involved in the generation of MEPs is
essential for describing their appropriate use,
explaining their behavior, understanding their value,
and knowing their limits during the monitoring of the
CT. Generation of MEPs is more complex in nature than
the generation of the D and I waves. Therefore, their
interpretation, especially during anesthesia, is rather
complex. Generation of MEPs and their propagation to the
end organ (muscle) depends on (a) the excitability of
the motor cortex and the CT tract, (b) the conductivity
of CT axons, (c) the excitability level of α-motoneuron
pools, (d) the role played by the supportive system of
the spinal cord (helping to increase the excitability of
α-motoneurons), and (e) the integrity of motor nerves,
the motor endplates and muscles.
Recovery of Amplitude and
Latency of the D Wave
There is a frequency limit for the transmission of descending
volleys through the CT axons to the α-motoneurons. This limit
can be easily tested by applying two identical electrical
stimuli transcranially with different interstimulus intervals
(ISIs). This test can show the recovery time of the second D
wave response.
|
|
 |
|
Figure-11 Two diagrams showing the
relationship between interstimulus interval (ISI),
duration of stimuli, and recovery of the amplitude and
latency of the conditioning D wave. Two identical
stimuli have been applied transcranially with different
ISIs. Amplitude and latency of the second D wave (D2)
were compared to those of the first one (D1). Note that
earlier and complete recovery of the amplitude and
latency of the second D wave occurs with a stimulus
duration of 500 μs and an ISI of around 4 ms. |
Figure-12 Relationship between MEPs recorded epidurally
and from muscle. (A) Train of five stimuli are needed
with an ISI of 2 ms in order to elicit muscle MEPs in
tibialis anterior muscle (A5). (B) With an ISI of 4 ms,
only three stimuli are needed to elicit muscle MEPs in
the tibialis anterior muscle (B3). D = D wave; I = I
wave; PM = paraspinal muscle artifact. |
Using this paradigm
(conditioning and test stimuli), a D wave recovery curve can be
plotted relative to the amplitude and latency of the second D
wave (Fig.2-11). The optimal ISI for complete recovery of the
second D wave amplitude and latency is around 4 ms, using a
moderate stimulus intensity with a duration of 500 μs. Because
the α-motoneuron is optimally bombarded when the train of equal
stimuli elicits D waves of equal amplitudes, the optimal ISI for
muscle activation is expected to be 4 ms. Fig-12 indicates that
with an ISI of 4 ms, three stimuli are sufficient to elicit MEPs
because of the complete recovery of each consecutive D wave
(Fig-12 B3). Comparatively, using the identical stimulus
intensity but decreasing the ISI to 2 ms, five stimuli are
needed to elicit MEPs, which are of even smaller amplitude,
because of incomplete recovery of the amplitude of each
consecutive D wave (Fig-12 A5). This rule applies only if a
single stimulus elicits a single D wave.
Facilitation of I wave
We have been shown that three
stimuli applied transcranially over the motor cortex can elicit
more than three descending volleys in lightly anesthetized
patients. In Fig-12 A3, it is clearly visible that three stimuli
generate four descending volleys (D1, D2, D3, and an additional
I wave). Facilitation of previously nonexisting I waves (after a
single stimulus, Fig-12 A1) is one of the important factors
underlying the potency of the multipulse stimulating technique
for eliciting MEPs in lightly anesthetized patients.
Furthermore, it has been shown that because of the lack of
synchronicity of I waves, their recorded amplitude is only one
third of their actual amplitude. Certainly, if the patient is
deeply anesthetized, the cortical synapses where the I wave was
facilitated are completely blocked, so this phenomenon does not
occur.
Total Number of D and I Waves
To allow for the complete
recovery of the D wave, the ISI in the multipulse train should
be 4 ms. In situations where a single stimulus generates more
than a single D wave, the optimal ISI should be set long enough
to allow the entire set of D and I waves to recover, and in
turn, to allow the next set of D and I waves to fully develop.
Therefore, the second stimulus can generate the same pattern of
D and I waves (Fig-13). Otherwise, the second set of D and I
waves could fall into the CT axon refractory period resulting
from the first set. This is the case in Fig-13, where a single
stimulus generates a single D wave and multiple I waves (A). In
this case only two stimuli, 8 ms apart, were necessary to
generate the maximum amplitude of muscle MEPs (Fig-13D).
If the ISI is shorter (e.g., 4.1 ms in Fig-13B), partial
cancellation of the D and I waves elicited by a second stimulus
will occur. Consequently, the total number of D and I waves will
be insufficient to bring an α-motoneuron to the firing level and
MEPs will not be generated. This mechanism could be important in
the lightly anesthetized patient as well as in patients with
idiopathic scoliosis where a single stimulus generates multiple
I waves (see Fig-2).
|
|
|
Figure-13 (A) In this patient, a
single stimulus delivered over the exposed motor hand
area elicits a single D wave and multiple I waves. The
ISI should be long enough to prevent the second set of D
and I waves, elicited by a second stimulus, from falling
into the CT axon refractory period resulting from the
previous waves (as is the case in trace B). When the ISI
is 5.9 ms (C) and 8.0 ms (D), this will not occur,
resulting in a sufficient numbers of D and I waves to
elicit MEPs (trace D). The stimulus is marked by an
arrow and the D wave by an asterisk. |
|
|
Generation of
Muscle MEPs Depends on Two Systems: The CT and
the Supportive System of the Spinal Cord |
|
Descending activity
from the CT axons alone is not sufficient to generate
muscle MEPs in anesthetized patients. The other
system(s) should be activated as well. Three examples
support this statement:
A. If the multipulse technique (in a non-deeply
anesthetized patient) with a repetition rate of 1 or 2
trains per second is performed, each consecutive
response recorded from muscle will have an increasing
amplitude. In cases where the intensity of stimuli is
just slightly above the threshold, the first few trains
will not generate muscle MEPs at all. At the same time,
the D wave amplitudes remain the same (Fig-14).
B. In the patients with intramedullary spinal cord
tumors presented in Fig.15, recording of the D waves
from the left and right CT generates symmetrical D waves
cranially and caudally to the tumor site. Yet muscle
MEPs are significantly smaller over the right TA muscle
where the patient has clinical weakness. The presumption
is that the current required to elicit MEPs from muscles
on one side of the body is activating only one CT.
Therefore, the D wave, recorded from the spinal cord
using this same intensity, must predominantly belong to
one CT.
C. During surgery for intramedullary spinal cord tumors,
muscle MEPs can completely disappear with no significant
changes in the amplitude of the D wave (see further
transient paraplegia, Fig-16).
These three examples provide convincing evidence that
the generation of MEPs involves more than just the CT
system.
|
|
|
Figure-14 Recordings of 10
consecutive muscle MEPs from the right abductor
hallucis brevis muscle (after delivering 10 trains
consisting of five stimuli, pulse width of 100 μs,
intensity of 288 mA, stimulus rate of 1 Hz) over C3
anode/C4 cathode in a 60-year-old patient undergoing
anterior cervical spine decompression and
stabilization. Note that after the fifth train the
amplitude of the muscle MEPs increases 10-fold,
showing a tendency to further increase its
amplitude. |
Figure-15 Simultaneous recording
of the D wave from the right and left CT, cranial
and caudal to a midthoracic intramedullary spinal
cord tumor (upper), showing a symmetrical amplitude
of the D wave. At the same time, muscle MEPs showed
significantly smaller amplitude over the right TA
muscle when compared to the left, correlating with
the patient’s weakness in the right leg. This
recording indicates involvement of pathways other
than the CT in the generation of the MEPs. |
Figure-16 Muscle MEPs recorded
from right and left TA muscle (left) and D wave
recorded epidurally over the lower cervical spinal
cord (right). During surgery, muscle MEPs completely
disappeared while the D wave decreased in amplitude
(less than 50%), resulting in transient paraplegia
for this patient during surgery for an
intramedullary spinal cord tumor. The patient
recovered completely within a week. |
|
|
SURGICALLY
INDUCED TRANSIENT PARAPLEGIA |
|
During surgery for
intramedullary spinal cord tumors in the thoracic
region, MEPs in the TA muscles will frequently disappear
while the D wave remains unaffected. All patients
demonstrating this finding during surgery wake up
paraplegic (or monoplegic if the TA MEPs disappear in
one leg). In patients in whom was observed this
phenomenon, motor strength is typically recover in a few
hours to a few days following surgery. No permanent
motor deficits have been observed (Fig-16). With almost
all cases of transient paraplegia, the first changes are
seen in the MEPs and not in the parameters of the D
wave. This gives the surgeon a warning sign and a window
of time to plan to end the tumor removal. This is a
critical point for intraoperative planning of the extent
of tumor removal. If changes in the MEPs do not appear,
tumor removal can proceed until a gross total resection
is accomplished without the patients having permanent
motor deficits postoperatively.
Neurophysiological Basis for
Surgically Induced Transient Paraplegia
Taking into account the
previous evidence that the generation of muscle MEPs involves
more than just the CT, activation of the CT and other descending
systems within the spinal cord is necessary. The propriospinal
(diffuse) system of the spinal cord is activated by CT axons
that are linked via synaptic connections to the propriospinal
system within the spinal cord. In the case of surgically induced
transient paraplegia, this system is temporarily compromised by
selective surgery while the CT is left intact. After the patient
wakes up, other descending systems compensate for the lack of
propriospinal tonic influence on α-motoneurons. This results in
the fast recovery of these patients. This suggested mechanism is
speculative but from a prognostic and pragmatic point of view is
critical because it correlates extremely well with clinical
outcome. Comparatively, if the CT tract is damaged during
surgery (complete loss of D wave or decrement of the amplitude
compared with the baseline of more than 50%), a permanent motor
deficit isexpected.
Combining the information about the D wave and about the muscle
MEPs during surgery for intramedullary spinal cord tumors makes
this surgery safer, changes the intraoperative strategy, and
significantly diminishes the occurrence of postoperative
deficits.
|
|
Summary |
|
Historically,
intraoperative neurophysiology has progressed by means
of trial and error. Unfortunately, this has resulted in
a number of different opinions as to its utility in
documenting and preventing surgically induced
neurological injury. In spite of this, the methodology
for monitoring the functional integrity of the CT has
progressed over the last 20 years into a reliable, fast,
and relatively simple tool that is easily utilized
intraoperatively. The development of such a solid
methodology has given us reliable and specific data that
highly correlate with neurological outcome
postoperatively. This correlation and the published
surgical outcome data demonstrate the merits of these
techniques.
Further developments in intraoperative neurophysiology
should be directed toward developing a methodology for
the functional mapping of the nervous tissue in the
exposed brain, brainstem, and spinal cord during
surgery.
|
|
|
Starting from July-2007 all the surgical activities of
Prof. Munir Elias will be guided under the electrophysiologic control of
ISIS- IOM
ISIS-IOM Inomed Highline

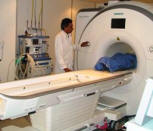
Starting from 28-November-2013 Skyra with all clinical applications in
the run. |
|