|
|
Information box |
The main purpose of this site is to extend the
intraoperative monitoring to include the neurophysiologic
parameters with intraoperative navigation guided with Skyra 3
tesla MRI and other radiologic facilities to merge the
morphologic and histochemical data in concordance with the
functional data.
 CNS Clinic
Located in Jordan Amman near Al-Shmaisani hospital, where all
ambulatory activity is going on.
Contact: Tel: +96265677695, +96265677694.
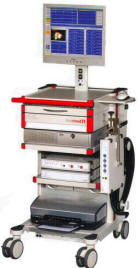
Skyra running
A magnetom Skyra 3 tesla MRI with all clinical applications
started to run in our hospital in 28-October-2013.
Shmaisani hospital
The hospital where the project is located and running diagnostic
and surgical activity. |
|
 |
|
|
 |
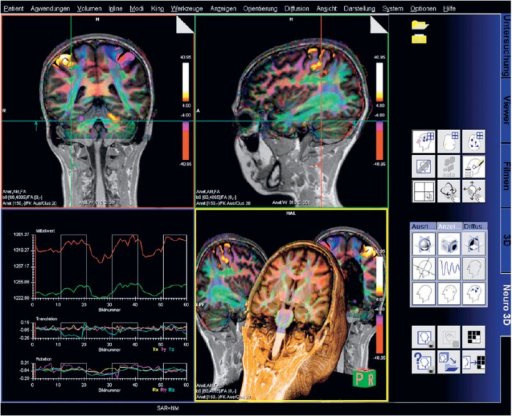
Neuro fMRI/DTI
Combi Package #T+D |
 |
 The Neuro
fMRI/DTI Combi Package is a bundle of:
The Neuro
fMRI/DTI Combi Package is a bundle of:
- Inline BOLD Imaging :Performing a Motor Cortex Functional Exam
- 3D PACE syngo : Prospective Acquisition CorrEction
- BOLD 3D Evaluation syngo
- fMRI Trigger Converter
- Diffusion Tensor Imaging
- DTI Evaluation
- DTI Tractography syngo
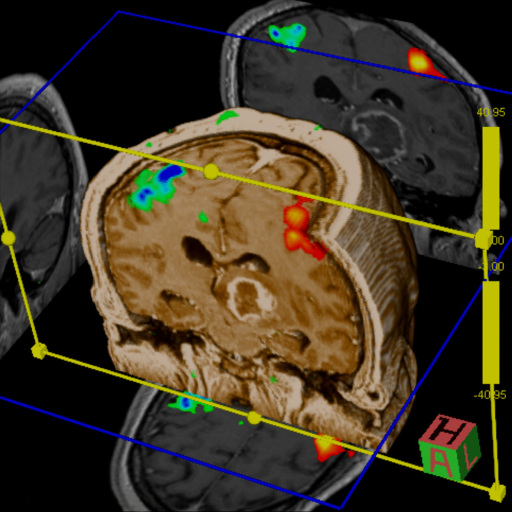
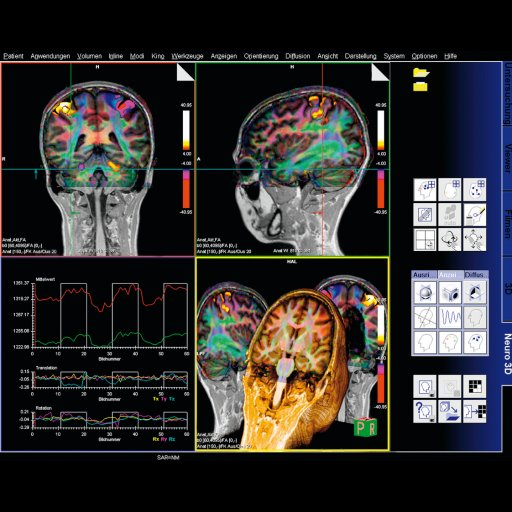
The bundle comprehends all acquisition and postprocessing tools
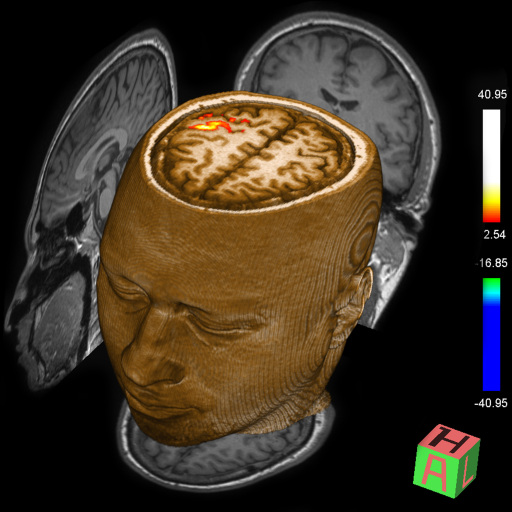
for comprehensive BOLD fMRI and DTI exams. BOLD fMRI experiments
can be displayed fused with DTI data and anatomy. The package is
particularly valuable for presurgical planning. The 3D display
of anatomical images, functional brain mapping results and DTI
allows a better understanding of the spatial relationship
between eloquent cortices, cortical landmarks, brain lesions and
tract shifts of white matter.
Inline BOLD Imaging
The BOLD imaging package allows the user to define protocols
which, apart from the measurement, configure automatic
evaluation of the measured data during the scan. With Inline
Technology it is thus possible to generate statistical images
(t-value) based on 3D motion corrected and spatially filtered
data automatically in real time without any further user
interaction. The Inline display of activation cards allows the
user to decide during the scan whether enough statistical power
has built up for his brain mapping task or if the examination is
corrupted by motion. As a result examinations will be shorter
with a higher success rate. Functional brain mapping can be
easily integrated into the clinical routine e.g. prior to
neurosurgical interventions.
Additional Features:
- Inline retrospective 3D motion detection and correction in 3
rotational and 3 translational directions
- Inline t-statistics calculation for variable paradigms and
display of t-value images
- Statistical evaluation by means of “General Linear Model
(GLM)”:
- Paradigms can be configured
- Transitions between passive and active states can be modeled
by the hemodynamic response function
- Correction of low-frequency trends
- Allows for time delays due to the BOLD-EPI slice order during
a measurement
- Display of GLM design matrix
- Display of a continuously updated t-value card during
measurement
- Display of colored activation cards continuously updated
during measurement, overlaid over the respective BOLD images
using Inline technology
- MOSAIC image mode for accelerating display, processing and
storage of images
3D PACE syngo
By tracking the patients head 3D PACE reduces motion resulting
in increased data quality beyond what can be achieved with a
retrospective motion correction. As a result the sensitivity and
specificity of BOLD experiments are increased.
Features:
- Real time prospective motion correction: Highest accuracy real
time motion detection algorithm feeding a real time feed back
loop to the acquisition system with updated positioning
information
- 3D motion correction for 6 degrees of freedom (3 translation
and 3 rotation)
- Motion related artifacts are avoided in first place instead of
correcting for them retrospectively
- Significant reduction of motion-related artifacts in
statistical evaluations
- Increased sensitivity and specificity of BOLD experiments
BOLD 3D Evaluation syngo
syngo BOLD 3D Evaluation is a comprehensive processing and
visualization package for BOLD fMRI.
Features
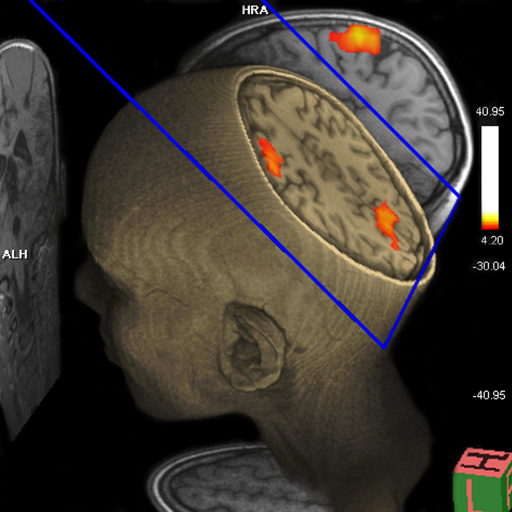
•This package provides statistical map calculations from BOLD
datasets and enables the visualization of task-related areas of
activation with 2D or 3D anatomical data. This allows the
visualization of the spatial relation of eloquent cortices with
cortical landmarks or brain lesions
•On the syngo Acquisition Workplace the unique Inline function
of syngo BOLD 3D Evaluation merges, in real time, the results of
ongoing BOLD imaging measurements with 3D anatomical data
•Additionally, evolving signal time courses in task-related
areas of activation can be displayed and monitored
•Functional and anatomical image data can be exported for
surgical planning as DICOM datasets, additionally all color
fused images and results can be stored or printed
•Statistical map generation: paradigm definition, calculation of
t-value map with General Linear Model or t-test
•3D Visualization: fused display of fMRI results,
color t-value maps on anatomical datasets
•Inline 3D real time monitoring of the fMRI acquisition
•On-the-Fly adjustment for t-value thresholding, 3D clustering,
and opacity control
•Data export to neurosurgical planning software
Clinical Applications
•Neurosurgical planning
•Assess the effects of neurodegenerative diseases, trauma or
stroke on brain function
•Brain mapping
 |
 |
| BOLD evaluation task
card |
BOLD evaluation task
card |
Step by step:
1. Load the ep2d_bold_moco series into the BOLD Evaluation Task
card. From the patient browser, select this series and go to
Applications and choose BOLD Evaluation.
2. Choose the moco filter 3D evaluation program. Automatically
the evaluation controller dialog box will appear, when post
processing BOLD data it is freely selectable to choose filters
or motion
3. Adjust the simple clustering to remove noise from BOLD data.
Increasing this value will remove any colored clustered pixels
lower than this number. For example when setting this value to
10 any value of activated (colored) adjacent pixels less than 10
will be hidden from view.
4. Load the t1_se_tra sequence into segment
1. From the patient browser select this sequence and drag and
drop into the upper left segment. This will fuse the BOLD data
with anatomic data
5. Scroll thru the images using the "dog ear tab" of segment
one. This will also move the fused anatomic and functional
slices.
6. Set the transparency of the functional data. Reducing the
Alpha Value will make the functional data more transparent.
7. Save the fused results. Go to patient, and select Save All
Alpha As... This will save all slice positions and allow naming
of the sequence, for easy access in the patient browser.
This series can now be viewed in the viewing card or sent via
PACs for reading.
All tasks from statistical evaluation of the fMRI datasets to
reading and exporting results are supported by BOLD 3D
Evaluation syngo:
Generation of statistical maps:
- In cases an inline calculated statistical map is not available
a statistical map can be generated easily using processing
protocols. An intuitive editor UI allows the paradigm definition
and offers the selection of head motion correction, image
filters and statistical evaluation.
- Predefined processing protocols and paradigms are available,
which can be edited if required.
Statistical evaluation using General Linear Model (GLM)
- Transitions between passive and active states modeled by the
hemodynamic response function.
- Correction of low-frequency trends.
- Corrects for time delays due to the BOLD-EPI slice order
during a measurement.
- Output of a t-value map and the GLM design matrix
Inline monitoring of the fMRI exam
- During an ongoing BOLD imaging exam results are calculated (by
Inline BOLD imaging) and displayed in real time.
- The results are displayed and continuously updated as an
overlay on online adjustable, free angulated cut planes through
the anatomical 3D data set.
- The evolving signal time courses in task-related areas of
activation can be displayed and monitored.
Visualization of fMRI Results
- Visualization with 3D volume rendering.
- Superimposing on cut planes through the volume.
- Interactive Navigation: Zoom, pan and rotate in 3D without
noticeable delay. Free double oblique angulation of up to 6 cut
planes.
- Cine display of the BOLD time series and of EPI volumes in 3
orthogonal cuts for evaluation of non-corrected head motion.
Data Quality Monitoring
- Based on the B0 field map, loaded automatically with the fMRI
data, areas with less reliable results are indicated.
fMRI Trigger Converter
An optical trigger signal is available to trigger external
stimulation devices in fMRI experiments.
With the "fMRI Trigger Converter" this signal can be converted
to an electrical signal (TTL/BNC and RS 232 interface for PC;
modes: toggle or impulse).
Diffusion Tensor Imaging
Diffusion Tensor Imaging allows for a complete description of
the diffusion properties of the brain within the scope of the
tensor diffusion model, both for anisotropic and isotropic
diffusion. Efficient diffusion direction schemes are pre-defined
to allow for optimal diffusion directional resolution. Schemes
with up to 256 directions can be selected.
Inline technology enables automatic and immediate calculation of
the diffusion tensor, including grey-scale and colored
“fractional anisotropy" (FA) map derived from it.
Details:
- Measurements with up to 256 different directions and with up
to 16 different b-values
- Inline calculation of tensor, grey-scale and colored FA map,
ADC map and trace-weighted image
- Support of parallel imaging (iPAT)
- Clinical protocols with full head coverage, incl. inline
calculation of tensor, FA, ADC and trace-weighted images in 4
minutes.
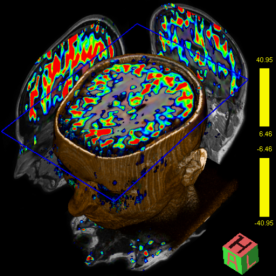
DTI Tractography syngo
syngo DTI Tractography is optimized for the clinical use by
providing advanced 3D visualization of white matter tracts in
the context of 2D or 3D anatomical datasets and DTI datasets.
DTI data sets can be explored fast and intuitively using the
interactive QuickTracking. QuickTracking instantaneously
displays the tract originating from the mouse pointer position
while moving over the DTI data set. This also allows identifying
qualified regions to place seeding ROIs. Seed points can be set
to assess connectivity by tracking with single ROI and with
multiple ROIs. Furthermore they can be placed in fused views
displaying the anatomical reference and e.g. the colored FA map
simultaneously.
Texture Diffusion, a highly versatile in-plane visualization of
white matter tracts, allows to display and read DTI Tractography
results on PACS reading stations and in the OR.
At the same time the package provides the scientific user with
the flexibility to configure the tracking algorithm and to
change display settings for the tracts. Tract and seeding ROI
statistics are included to support publications (e.g. mean/max
FA value, min/mean/max ADC value).
All views can be exported as DICOM images or bitmaps. Tract and
seeding ROI statistics can be exported as html files.
DTI Evaluation
Clinical applications are supported by a dedicated DTI
evaluation mode to support diagnostics of white matter diseases
(e.g. multiple sclerosis and brain maturation disorders). Based
on the tensor, in addition to the already inline-calculated
parameter maps, further maps characterizing the anisotropy of
diffusion properties can be calculated and stored. Multiple
diffusion parameter maps (e.g. Fractional Anisotropy, ADC, b=0)
and an anatomical image are displayed next to each other in the
same slice position for comparison. The images can be evaluated
together based on ROIs and the results can be documented in a
table. The display options include 2D and 3D tensor graphics,
colour-coded images and overlay images on the anatomical images.
In addition, the package offers the scientific user full
flexibility of 2- and 3-dimensional visualization of the
diffusion tensor with measures of isotropic and anisotropic
(fractional and relative) diffusion, Eigen vectors (E1, E2, E3)
of the diffusion tensor and shape-descriptive measures of the
diffusion tensor (linear, planar, spherical).
|
|
Prostate
Package #T+D |
|
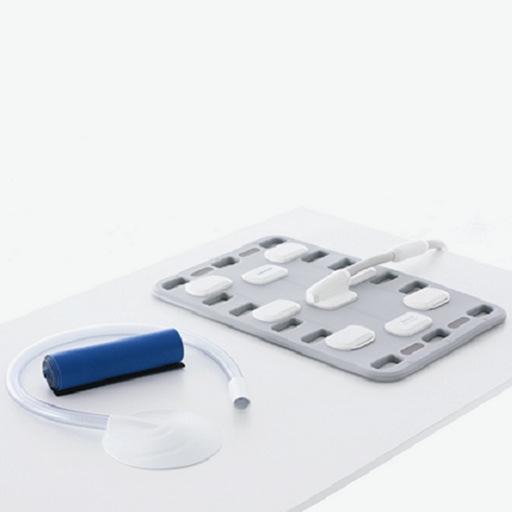
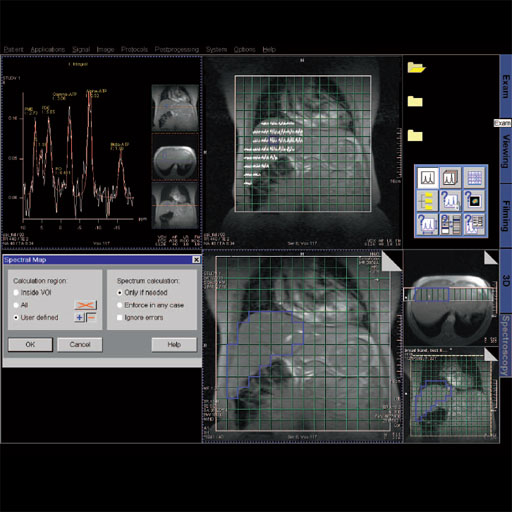
The prostate spectroscopy package is an comprehensive
software package which bundles:
- Single Voxel Spectroscopy
- 2D Chemical shift Imaging
- 3D Chemical Shift Imaging
- Spectroscopy Evaluation syngo
- syngo Tissue 4D Evaluation
Sequences and protocols for proton spectroscopy, 2D and 3D
proton chemical shift imaging (2D CSI and 3D CSI) to examine
metabolic changes in the prostate are included. Furthermore
included is the comprehensive Spectroscopy evaluation software
which enables fast evaluation of spectroscopy data on the syngo
Acquisition Workplace.
Tissue 4D is an application for visualizing and post-processing
dynamic contrast-enhanced 3D datasets.
Tissue 4D provides two evaluation options:
- Standard curve evaluation
- Curve evaluation according to a pharmacokinetic model.
The spectroscopy evaluation software is fully integrated in
syngo MR.
Evaluation protocols adapted to the scan protocols carry out a
complete and automatic evaluation of the measured data.
Optimized protocols for 3D CSI in the prostate are included.
The following functions are included:
- Subsequent water suppression with optional phase correction
- Apodization
- Zero filling
- Fourier transformation
- Base line correction
- Automatic or manual phase correction
- Curve fitting and peak labeling
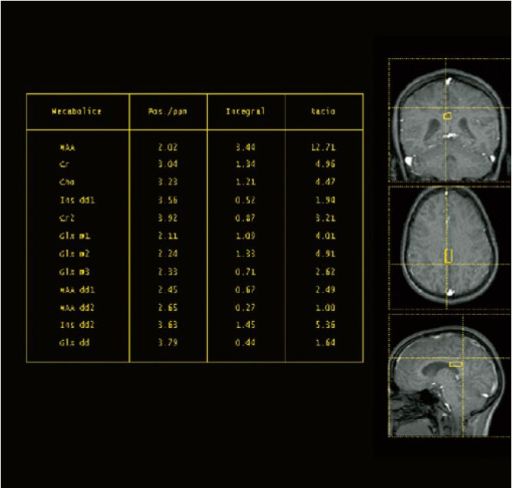
- Summaries in tabular form of the essential results specifying
the metabolites, their position, integrals and signal ratios in
relation to a selectable reference.
Tissue 4D provides the tissue visualization features:
- 4D visualization (3D and over time)
- Color display of parametric cards (Ktrans, Kep, Ve, Vp, iAUC)
- Additional visualization of 2D or 3D morphological dataset
Post-processing features:
- Elastic 3D motion correction
- Fully automatic calculation of subtracted images
Standard curve evaluation:
- Calculation and display of enrichment curves
Pharmacokinetic model:
- Pharmacokinetic calculation on a pixel-by-pixel basis using a
2-compartment model
- Calculation is based on the Toft model. Various model
functions are available.
- Manual segmentation and calculation on the result images.
The following result images can be saved as DICOM images:
- 3D motion-corrected, dynamic images
- Colored images
- Possibility for exporting results in the relevant layout
format.
|
|
Cardiac Dot
Engine #T+D |
|
Cardiac examinations used to be the most complex
exams in MR. Now Cardiac Dot Engine supports the user in
many ways. Using anatomical landmarks, standard views of
the heart, such as dedicated long axis and short-axis
views, are easily generated and can easily be reproduced
using different scanning techniques. Scan parameters are
adjusted to the patient’s heart rate and automatic voice
commands are given. All of this takes most of the
complexity out of a cardiac exam and supports customized
workflows that are easy to repeat. Every time.
Guidance View
- Step-by-step user guidance is seamlessly integrated.
- Example images and guidance text are displayed for the
individual steps of the scanning workflow.
- Both images and text are easily configurable by the
user
Patient View
- Within the Patient View the user can easily tailor the
exam to each individual patient (e.g. patient with
arrhythmia, breath hold capability).
- Pre-defined Dot Exam Strategies are integrated. The
user just selects the appropriate strategy with one
click and the queue and the complete scan set-up are
automatically updated
AutoFoV (automatic Field of View calculation)
- Based on the localizer images the optimal FoV is
automatically estimated.
- In case the patient moves during the examination, this
step can be repeated at any time
Automated parameter adaptation
- Scan parameters are automatically adapted to the
patient’s condition (e.g. heart rate)
Novel heart localization method
- On-board guidance visually facilitates anatomic
landmark settings which are used for calculation
- Automated localization
- Automated localization of short-axis views
Guided slice positioning
- Easy way to match slice positions (short-axis) between
cine, dynamic imaging, tissue characterization
Cardiac Views
- Easy selection of cardiac views (e.g. 3 chamber view)
during scan planning
Inline Ventricular Function Evaluation
- syngo Inline VF performs volumetric evaluation of
cardiac cine data fully automatically right after image
reconstruction.
- No user input necessary. If desired, inline calculated
segmentation results can be loaded to 4D Ventricular
Function Analysis for further review or processing
Inline Time Course Evaluation
- Automatic, real-time and motion corrected calculation
of parametric maps with inline technology
Cardiac specific layout for the Exam task
- Automatically chosen layouts show the new physio
display and are configured for every step of the exam
- Automatic display of images
- Automatic display of images in dedicated cardiac image
orientations in contrast to standard DICOM orientations
Adaptive triggering
- Acquisition adapts in realtime to heart rate
variations for non cine applications
Automated Naming
- Automated naming of series depending on cardiac views
and contrast
Auto Voice Commands
- Auto Voice Commands are seamlessly integrated into the
scanning workflow. The system plays them automatically
at the right time point. This ensures optimal timing of
scanning, breathing and contrast media. The user can
monitor which breath-hold or pauses are actually played,
and could add pauses between the automatic breath hold
commands if necessary
Dot Exam Strategies
The workflow can be personalized to the individual
patient condition and clinical need. The following
predefined strategies are included. They can be changed
at any time during the workflow:
- Standard: Segmented acquisition techniques
- Limited patient capabilities: switch to realtime and
single shot imaging if breath-hold is not possible or
arrhythmias occur
Customization
Existing Dot Engines can be modified by the user to
their individual standard of care.
- Add/remove protocol steps
- Change guidance content (images and text)
- Change or add Dot Exam Strategies and Decision Points
- Modify the Parameter View
|
|
3D VRT syngo |
|
This application provides a dedicated evaluation
software for colored, volume rendered (VRT)
visualization of MR and CT data as a complement to
traditional MIP display.
The combination of automated segmentation and
easy-to-use editing tools, provides users with a rapid
way to visualize MRA and VIBE studies in their 3D
context in a clear and precise manner.
3D VRT includes tools for:
Direct Volume Rendering Technique (VRT) for viewing 3D
volumes
- Projection of volume information onto an arbitrarily
orientation plane.
- For each projection ray the density, opacity, and
refraction of the penetrated volume is evaluated and the
resulting intensity/color is recorded.
- Independent control of color, opacity and shading of
up to 4 tissue classes.
- Selection of predefined color VRT settings via an
image gallery
- User selectable visualization filters for MPR, MIP,
SSD or VRT
- Storage and filming of reconstructed images or ranges
Editing Functions to create and modify segmented objects
- Segmentation of 3D datasets either with manual contour
creation, by thresholding, or by volume growing
operations.
- Volume measurements
|
|
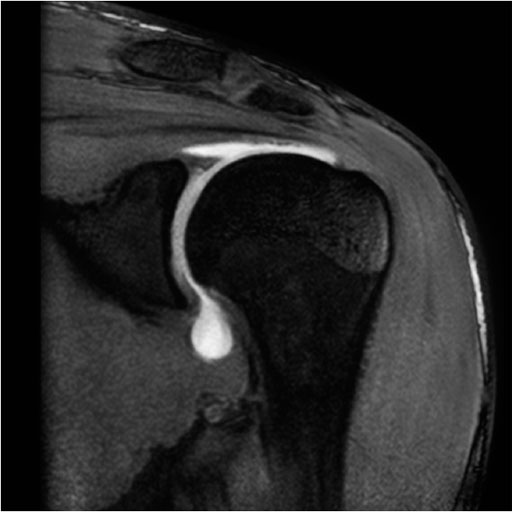
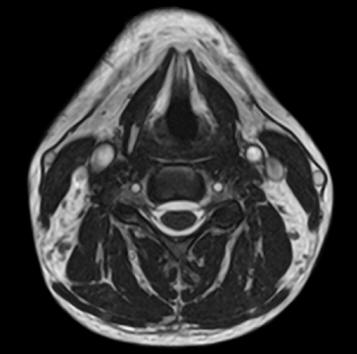
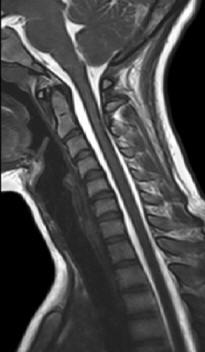
Ortho Package |
|
This package includes:
- 2D TSE protocols for PD, T1 and T2-weighted contrast
with high in-plane resolution and thin slices
- 3D MEDIC, 3D TrueFISP protocols with water excitation
for T2-weighted imaging with high in-plane resolution
and thin slices
- High resolution 3D VIBE protocol for MR arthrography
(knee, shoulder and hip)
- 3D MEDIC, 3D TrueFISP, 3D VIBE protocols with water
excitation having high isotropic resolution, optimized
for 3D post-processing
- PD SPACE with fat saturation and T2 SPACE with high
isotropic resolution optimized for 3D post-processing
- Whole spine single-step or multi-step protocols
- Excellent fat suppression in off-center positions,
e.g. in the shoulder due to high magnet homogeneity
- Dynamic TMJ and ilio-sacral joint protocol
- Susceptibility-insensitive protocols for imaging in
the presence of a prosthesis
- Multi-Echo SE sequence with up to 32 echoes for the
calculation of T2 time maps (calculation included in the
Scientific Suite)
- High resolution 3D DESS (Double Echo Steady State): T2
/ T1-weighted imaging for excellent fluid-cartilage
differentiation
|
|
Other
Clinical Applications |
|
|
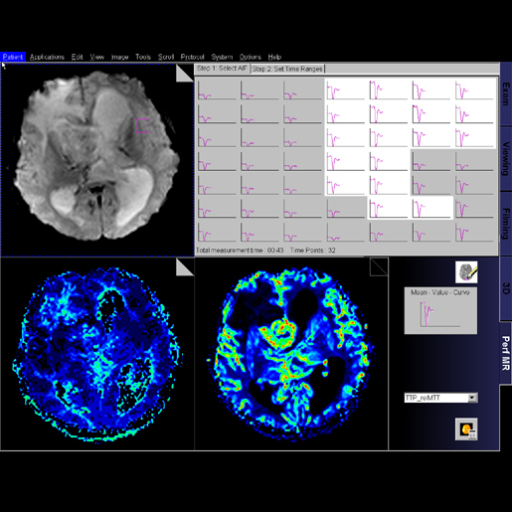
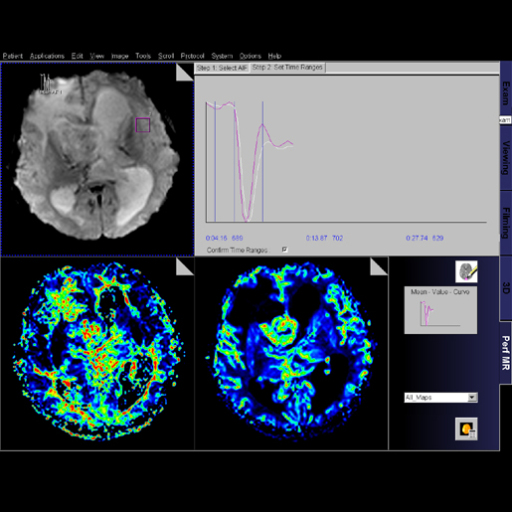
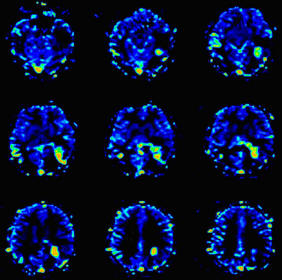
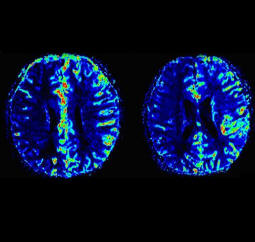
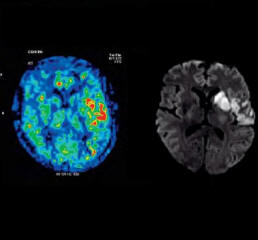
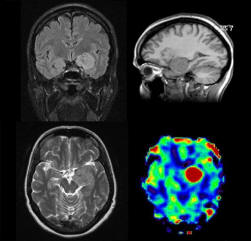
syngo ASL (Arterial Spin Labeling) 2D: Arterial Spin
Labeling (ASL) is an MR technique using the water in
arterial blood as an endogenous contrast agent to
evaluate perfusion noninvasively.
syngo ASL provides unique insight into human brain
perfusion and function physiology by evaluating cerebral
blood flow. syngo ASL is capable of high spatial
resolution perfusion imaging, making the technique very
appealing in the evaluation of stroke, tumors,
degenerative diseases, epilepsy but also in basic
neuroscience, e.g. for studies of functional CBF
changes.
• Fully compatible with iPAT
• Includes 3D PACE motion correction for increased
reliability
• Fully automated Inline calculation of regional blood
flow color maps
• Supports the “Pulsed Arterial Spin Labeling” –
technique (PASL)
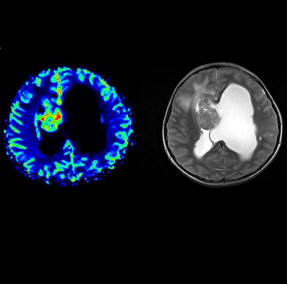
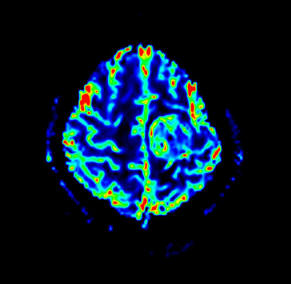
syngo ASL (Arterial Spin Labeling) 3D: Arterial Spin
Labeling (ASL) is an MR technique using the water in
arterial blood as an endogenous contrast agent to
evaluate perfusion noninvasively. syngo ASL provides
unique insight into human brain perfusion and function
by evaluating cerebral blood flow. syngo ASL is capable
of high spatial resolution perfusion imaging, making the
technique very appealing in the evaluation of stroke,
tumors, degenerative diseases, epilepsy but also in
basic neuroscience, e.g. for studies of functional CBF
changes.
• Fully compatible with iPAT
• Includes 3D PACE motion correction for increased
reliability
• Fully automated Inline calculation of relative blood
flow color maps
• Supports the “Pulsed Arterial Spin Labeling” –
technique (PASL)
• 3D-GRASE ASL sequence: A 3D volume acquisition with
echo planar imaging and multiple refocusing pulses to
increase signal-to-noise
and to speed-up scan times. Multi-phase and multislice
acquisition is supported
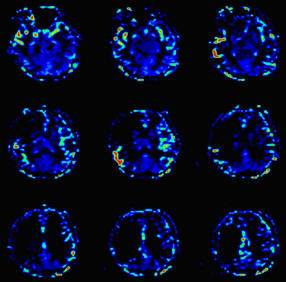
syngo ASL (Arterial Spin Labeling)
syngo ASL is an MR technique using the water in arterial
blood as an endogenous contrast agent to evaluate
perfusion non-invasively. syngo ASL provides a robust
Pulsed Arterial Spin Labeling sequence with echoplanar
readout and in-line calculation of CBF maps from the
acquired data.
Clinical Applications
•Acute stroke
•Evaluation of TIA (Transient Ischemic Cerebral Attack)
and chronic cerebrovascular disease
•Degenerative diseases like Alzheimer’s disease and
frontotemporal dementia
•Evaluation of brain tumors
•Functional evaluation of the brain with BOLD techniques
•Intervention planning
Features
•Compatible with GRAPPA parallel acquisition technique
•Compatible with standard 12 channel head matrix coil
and 32 channel head coil
•Highly robust single shot EPI Pulsed Arterial Spin
Labeling sequence with the use of 3D PACE and in-line
calculation of CBF maps
Additional Information
In syngo ASL, first, arterial blood water is
magnetically labeled just below the region of interest
by applying a 180 degree radiofrequency (RF) inversion
pulse. The result of this pulse is inversion of the net
magnetization of the blood water. In other words, the
water molecules within the arterial blood are labeled
magnetically. After a period of time (called the transit
time), the magnetically labeled water flows into the
region of interest where it exchanges with tissue water.
The inflowing inverted spins within the blood water
alter total tissue magnetization, reducing it and,
consequently, the MR signal and image intensity. During
this time, an image is taken (called the
tag image). The
experiment is then repeated without labeling the
arterial blood to create another image (called the
control image). The tagstate is alternated with the
control state, in which the magnetization of the
arterial blood is not inverted. The control image and
the tag image are subtracted to produce a
perfusion
image. This image will reflect the amount of arterial
blood delivered to the slice within the transit time.
There are mainly two techniques for syngo ASL; PASL
(Pulsed ASL) and CASL (Continuous ASL). In PASL, the RF
pulse is applied in a spatially selective manner
(region-specific). Consequently the inversion of the
arterial blood occurs over a specific area. PASL is
particularly attractive for higher field strengths as
other syngo ASL schemes such as CASL have to deal with
the challenge of high Specific Absorption Rate (SAR).
|
 |
|
 |
|
   |
|
|
Step by step guide: 1. Locate the ASL sequence
under Head > Advanced applications libraries. Select the
sequence labeled ep2d_tra_pasl.
2. Open the ASL sequence and position slices over the
area of interest.
3. To change the ASL parameters, go to the contrast
parameter tab and then the ASL sub-tab.
4. For parameter descriptions within the ASL sub-tab,
float the cursor over the various parameter choices.
5. After positioning your slices over the desired
location and adapting the ASL parameters (if necessary),
start the measurement.
6. After measurement is complete, review inline maps in
the Viewing Task Card. |
|
|
|
|
Other Clinical Applications Packages:
- Syngo BLADE
syngo BLADE reduces dramatically sensitivity to movement in
MR scanning. It is a technique that incorporates a k-space
trajectory radial in nature and reduces motion artifacts and
helps visualize the smallest lesions in non-cooperative
patients or when scanning is not optimal due to other
involuntary motion like pulsation, respiration, etc.
Features
Images in all slice orientations
Applicable in all body regions like head, spine, liver, knee
Compatible with Tim coil system and parallel acquisition
technique (iPAT)
Can be used with PACE (Free-breathing technique)
Multiple contrasts are possible (T1, T2, Dark Fluid, STIR….)
Clinical Applications
Reduce sedation rates in pediatric and anxious patients, and
get high-quality images to make a diagnosis
Reduce physiologic motion artifacts: Pulsation of blood
vessels, respiratory artifacts, tremor
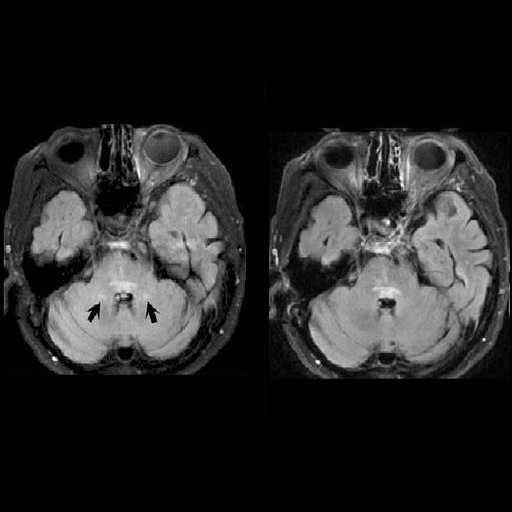
Especially effective in reducing CSF pulsation artifacts at
3T even in non-cooperative patients
Additional Information
syngo BLADE is a motion insensitive, multi-shot Turbo Spin
Echo (TSE) sequence. Inter-shot motion correction is applied
for reducing in-plane motion artifacts. This technique
continuously acquires low resolution images during motion,
then measures and corrects for this motion. Data is acquired
in blades which include parallel phase-encoding lines.
Individual blades are rotated to cover a circle in the raw
data space.
 |
 |
 |
 |
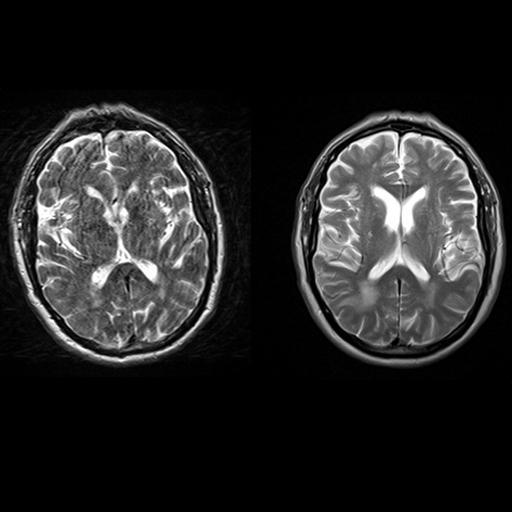
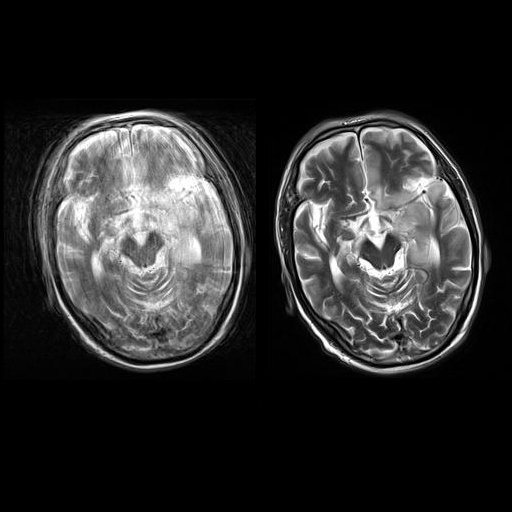
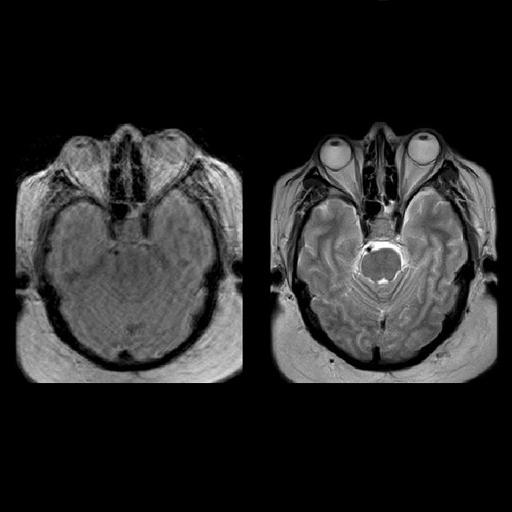
| Axial T2w TSE images of the brain (left: without
motion correction; right: with syngo BLADE) |
Axial T2w TSE images of the brain (left: without
motion correction; right: with syngo BLADE) |
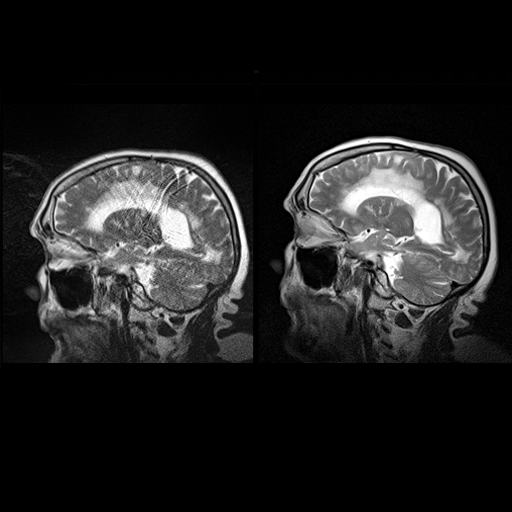
Sagittal T2w TSE images of the brain (left:
without motion correction; right: with syngo BLADE) |
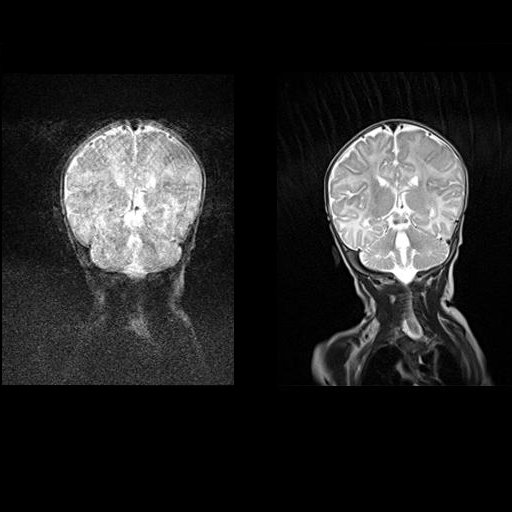
Coronal T2w TSE images of the brain (left:
without motion correction; right: with syngo BLADE) |
 |
 |
 |
 |
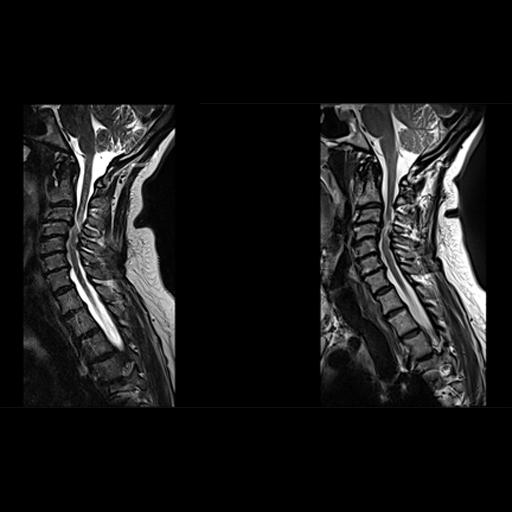
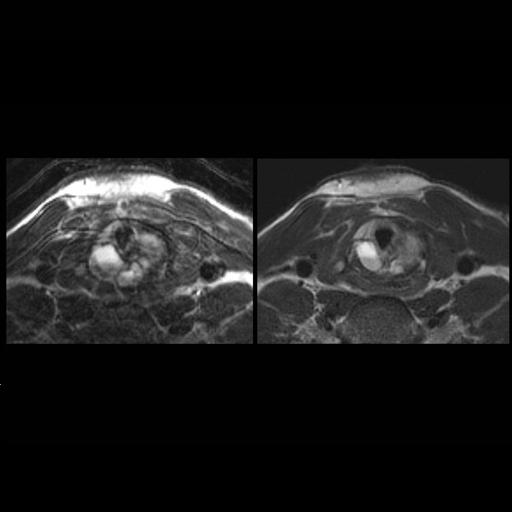
| Decreased pulsation and motion artifacts in
cervical spine syngo BLADE images (right) |
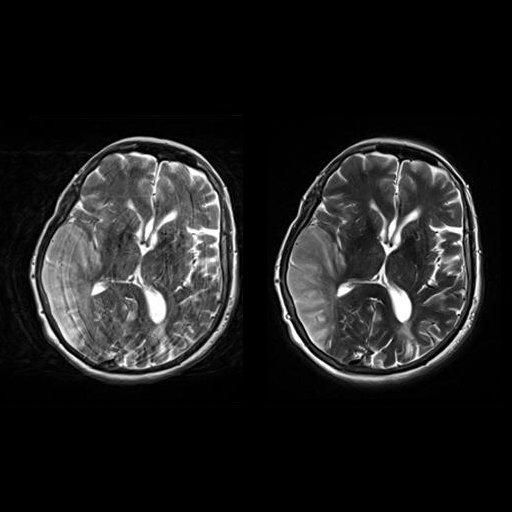
Axial T2w TSE images of the brain (left: without
motion correction; right: with syngo BLADE) |
Axial T2w TSE images of the brain (left: without
motion correction; right: with syngo BLADE) |
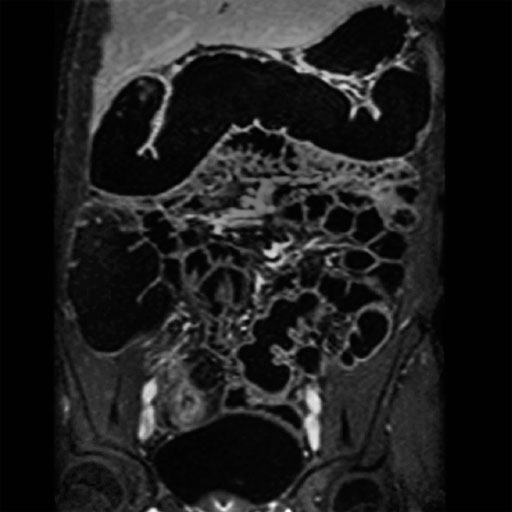
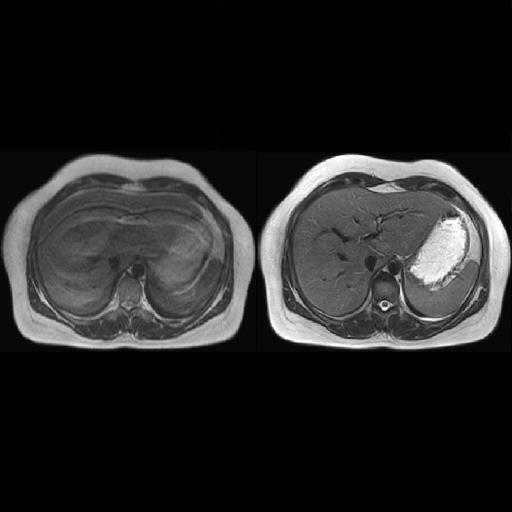
Reduced-breathing artifacts in the upper abdomen
with syngo BLADE |
 |
 |
 |
 |
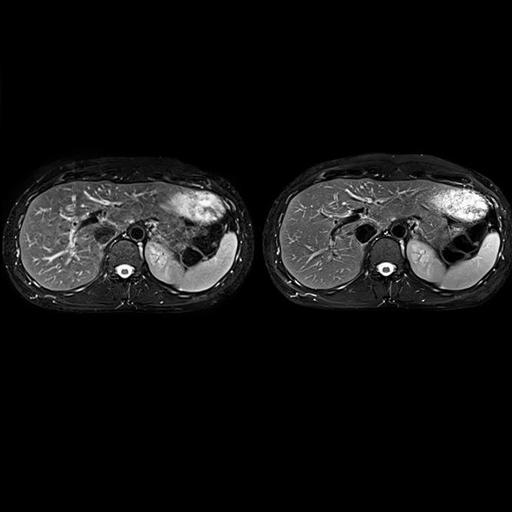
| Improved delineation of liver vessels by
reduction of pulsation artifacts with syngo BLADE |
Significant reduction of pulsation artifacts
with syngo BLADE |
Motion correction in a 530-lbs obese,
uncooperative patient with syngo BLADE |
Improved visualization of a cricoid mass with
syngo BLADE T2w MRI (aneurysmal bone cyst) |
Step by step:
1. Finding the syngo BLADE sequences in the Exam Explorer.
All syngo BLADE sequences are located in the BLADE folder of
each body region library.
2. syngo BLADE trajectory, located on the common Resolution
subtask-card.
3. BLADE Coverage parameter, located on the common
Resolution subtask-card.
4. Use of Motion Correction, located on the Sequence
subtask-card, part 2. A turbofactor of at least 29 must be
used to activate this option.
-
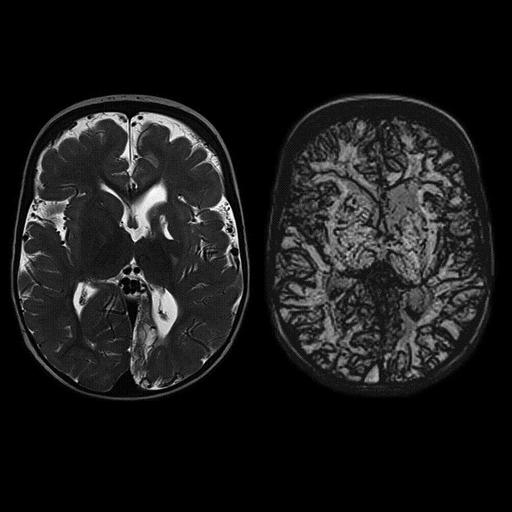
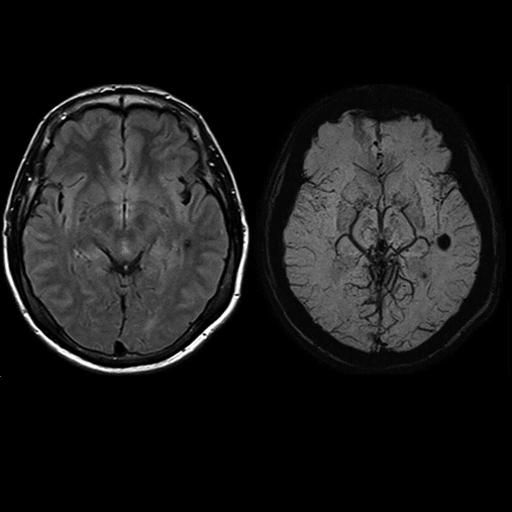
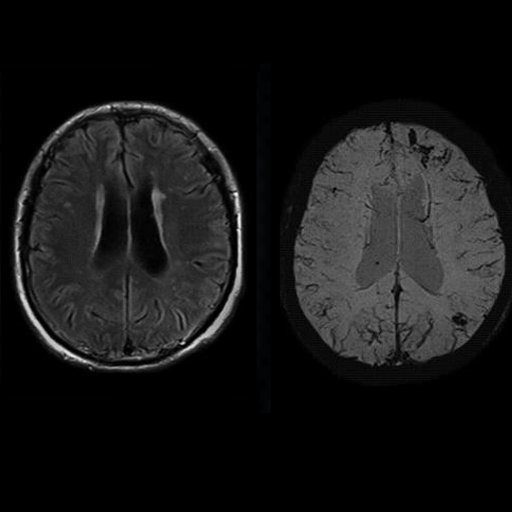
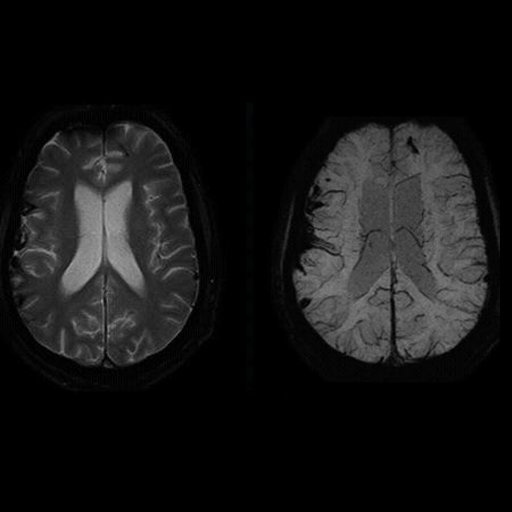
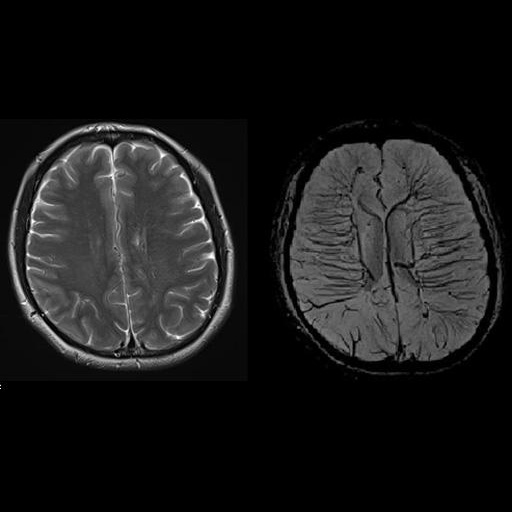
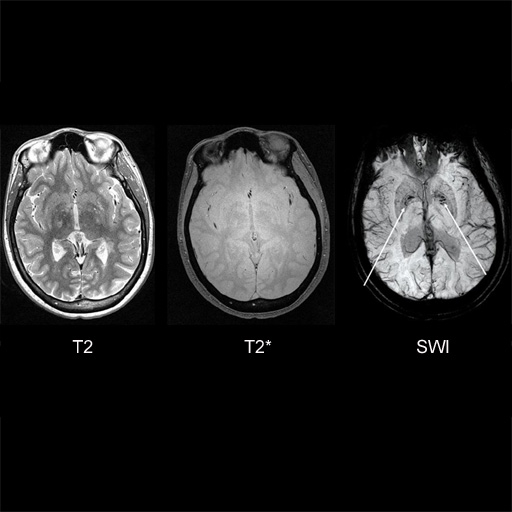
Syngo SWI: Siemens-unique sequence
technique for Susceptibility Weighted Imaging is a new type
of contrast in MRI which exploits the susceptibility
differences between tissues. As a result syngo SWI detects
substances with different susceptibilities than their
neighboring tissues such as deoxygenated blood, products of
blood decomposition and microscopic iron deposits much
better than conventional MR techniques. Among other things,
the method allows for highly sensitive proof of cerebral
hemorrhage and high resolution display of venous cerebral
vessels.
Clinical Applications
Improved detection of hemorrhage, microbleeding (diffuse
axonal injury), hemorrhagic transformation (stroke)
Detection of occult vascular disease (cavernomas, angiomas,
telangiectasias)
Diagnosis of cerebral venous thrombosis, intra-arterial clot
detection
Identification of iron and other mineral deposition
Helpful in MR diagnosis of neurodegenerative diseases
(Alzheimer’s, multiple sclerosis, etc.)
Tumor characterization
Features
syngo SWI is compatible with iPAT (integrated Parallel
Acquisition Technique) and takes only a couple of minutes,
like conventional imaging sequences, but with improved
sensitivity to blood, hemorrhage, mineralization deposits
etc.
Additional Information
syngo SWI combines magnitude and phase information from a
high-resolution, fully velocity compensated 3D FLASH
sequence. Phase images are unwrapped and high-pass filtered
to highlight phase changes associated with venous vessels
and converted into a mask that is multiplied with the
corresponding phase image.
 |
 |
 |
 |
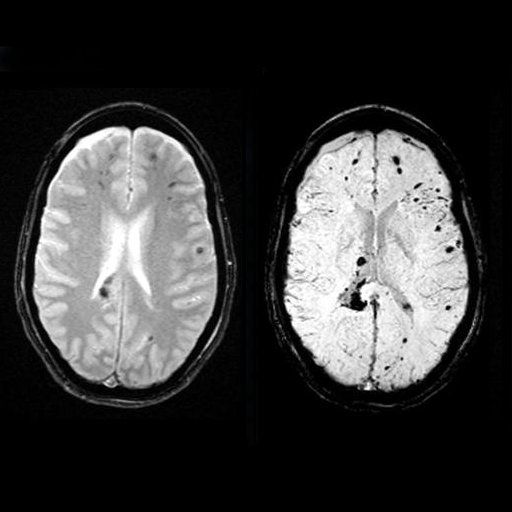
| Multiple cavernomas (syngo SWI right, T2* left) |
Multiple cavernomas, bleedings seen with syngo
SWI (SWI right, T2 left) |
Excellent visualization of venous congestions
with syngo SWI |
Improved visualization of an angioma with syngo
SWI |
 |
 |
 |
 |
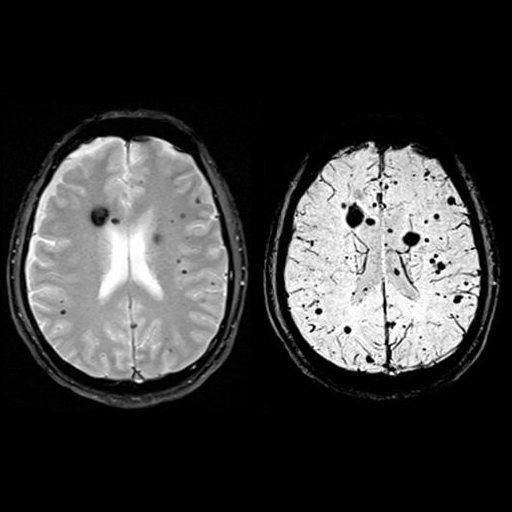
| Detection of bleedings in the gray matter
interface with syngo SWI |
Trauma imaging with syngo SWI for improved
detection of subtle bleedings |
Improved visualization of venous malformation
with syngo SWI |
MS patient. Iron deposition bilaterally in
globus pallidus interna is seen better with syngo
SWI |
Step by step:
1. Susceptibility Weighted Imaging of the brain
2. Location of syngo SWI sequences. In the exam explorer go
to Head, then Library and SWI.
3. syngo SWI Parameters. Sequence variant name SWI, it is a
3d gre sequence. On the contrast card the check box for SWI
must be selected to create the MinIP images.
4. Viewing results.
- TWIST: This package contains a Siemens-unique sequence
and protocols for advanced time-resolved (4D) MR angiography
and dynamic imaging in general with high spatial and
temporal resolution. syngo TWIST supports comprehensive
dynamic MR angio exams in all body regions. It offers
temporal information of vessel filling in addition to
conventional static MR angiography, which can be beneficial
in detecting or evaluating malformations such as shunts.
syngo TWIST can be combined with water excitation.
• Visualization of local changes of the magnetic field due
to tissue properties in general and due to the presence of
deoxygenated blood or blood decomposition products
• 3D GRE sequence with full flow compensation to support
venous angiography
• Enhanced susceptibility weighting of the magnitude images
by phase images to increase sensitivity to intracerebral
hemorrhage.
Features
Substantial reduction in gadolinium chelate dose
The ability to obtain multiple phases
No need for a test bolus (or any other kind of bolus timing)
iPAT in two directions with a factor up to 9 (optional with
iPAT extensions)
 |
 |
 |
 |
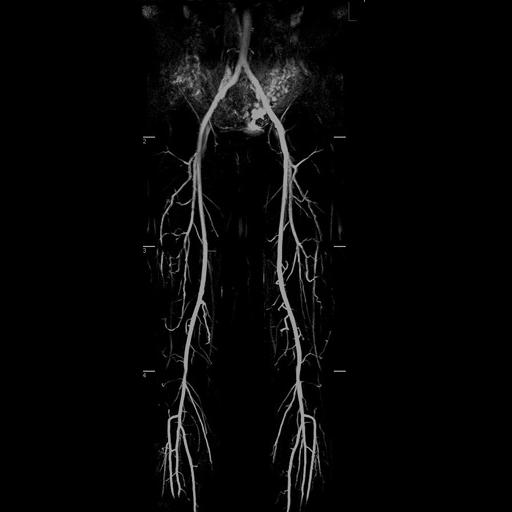
| Visualization of the lower leg
vessels, collaterals in a patient with stenoses and
occlusions |
MR angiography of the lower leg
vessels wit syngo TWIST |
Large FOV pulmonary MR
angiography with syngo TWIST |
Large FOV MRA of the supra-aortic, carotids and
vertebral vessels with syngo TWIST |
 |
 |
 |
 |
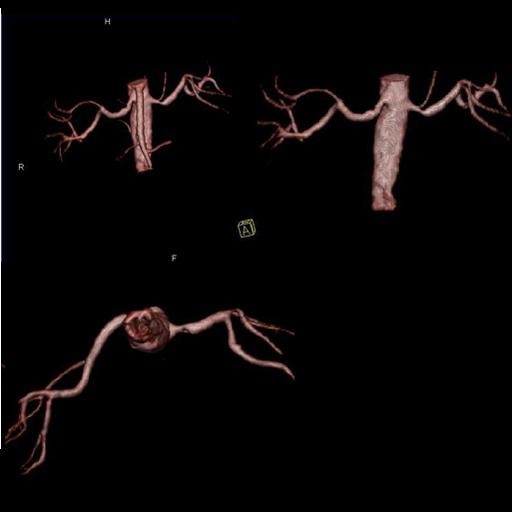
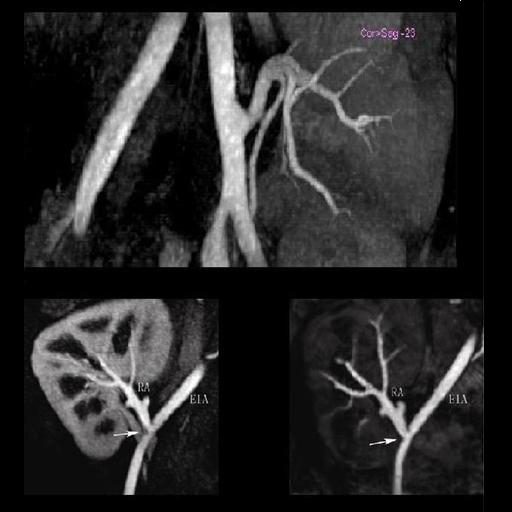
| syngo TWIST MRA shows filling of
the vessels and basilar artery aneurysm |
syngo TWIST shows left foot AVM
and delayed and reduced filling of the right lower
leg vessels |
syngo TWIST shows the AV shunt
and multiple stenoses of the brachial vein |
Large FOV MRA of the supra-aortic, carotids and
vertebral vessels with syngo TWIST |
Clinical Applications
Peripheral angiography (Better hemodynamic evaluation of
stenosis and collaterals, elimination of venous
contamination)
Dynamic cerebral MRA (Evaluation of cerebral AVMs, vascular
malformations)
Dynamic carotid, vertebral MRA (steal phenomenon, stenosis,
collaterals…)
Dynamic pulmonary MRA
Dynamic renal MRA
Dynamic mesenteric, portal MRA
Dynamic Aortography (Aortic dissection visualization,
differentiation of false and true lumen with the help of
dynamic MRA)
Additional Information
syngo TWIST is based on special k-space sampling. In this
setting, k-space is divided into two regions. The centrally
located region of k-space provides information regarding
image contrast, the peripherally located aspect of k-space
contributes principally to high spatial resolution. The main
factor contributing to the acceleration of the sequence
acquisition in this particular imaging approach is the fact
that k-space lines in the center are more frequently sampled
than are the k-space lines in the periphery during the
passage of the contrast medium bolus through the covered 3D
volume.
Step by step:
1. Locating syngo TWIST in the Exam Explorer
2. syngo TWIST: Angio parameter card
3. Central Region A; percentage of central k-space filled
per measurement
4. Sampling Density B; percentage of outer k-space filled
per measurement
5. Dynamic Reconstruction Mode; forward or backward share of
k-space
6. Measurement temporal Information
7. Burn Time-to-Center; burning measurement time on image
Locating Burn Time-to-Center information
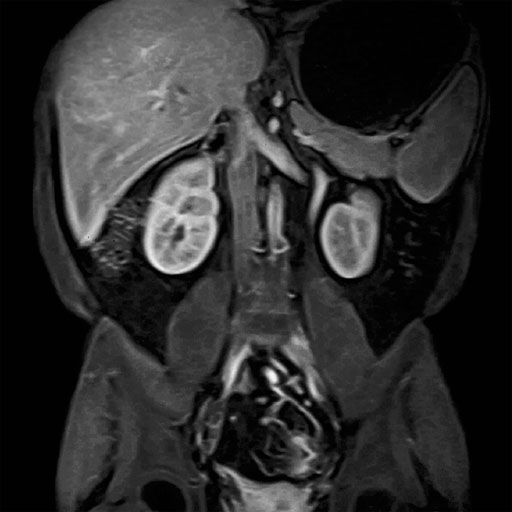
- NATIVE: Non-contrast MRA of ArTerIes and VEines – SPACE
and TrueFISP : Integrated software package with sequences
and protocols for non-contrast enhanced 3D MRA with high
spatial resolution. NATIVE particularly enables
imaging of abdominal and peripheral vessel
NATIVE offers:
• Non-contrast MRA
• Separate imaging of arteries and veins
• Visualization of – e.g. – renal arteries or peripheral
vessels
The syngo NATIVE package comprises:
• syngo NATIVE TrueFISP
• syngo NATIVE SPACE
syngo NATIVE is a contrast-free MR angiography technique for
visualizing the vessels of the body. The package contains
protocols tailored for use in different body regions (e.g.
renal arteries, peripheral vessels). Inline Subtraction and
Inline Maximum Intensity Projection (MIP) further simplify
the workflow.
Clinical Applications
Alternative to contrast-enhanced MRA examinations when there
is contraindication to use of Gadolinium.
Additional Information
For non-contrast MR Angiography Siemens currently offers two
techniques under the category of syngo NATIVE — syngo NATIVE
TrueFISP and syngo NATIVE SPACE. syngo NATIVE TrueFISP is
based on the TrueFISP (True Fast Imaging with Steady state
Precession) sequence, which is a balanced steady state
gradient echo technique. The contrast mechanism for syngo
NATIVE TrueFISP comes from the preparation of the imaging
volume with a spatially selective inversion pulse, resulting
in the suppression of stationary tissue within the imaging
volume and suppression of signal from blood in the imaging
volume (e.g. venous blood). Blood which flows into the
imaging volume during the inversion time has the same
high-signal characteristics exhibited in that TrueFISP. The
contrast is further enhanced by the suppression of the
background by the inversion pulse. The sequence can be made
selective for arteries or veins by appropriate positioning
of the inversion pulse, which can be positioned
independently from the imaging volume. The sequence
accommodates 3D, 2D, breath-hold, syngo PACE (Prospective
Acquisition CorrEction) navigated and respiratory triggered
approaches depending on clinical environment.
The syngo NATIVE SPACE technique is a modified variable flip
angle 3D Turbo Spin Echo sequence in which the contrast
mechanism for visualizing vessels is based on the difference
in intravascular signal between maximal and minimal flow
during the cardiac cycle. The subtracted image is calculated
Inline and with Inline MIP generation, instantaneous
clinical results are produced for completely non-invasive MR
angiography, further improving workflow at the scanner. The
syngo NATIVE SPACE technique can also accommodate
multi-phase imaging that enables dynamic angiography — for
example, in the lower legs.
 |
 |
 |
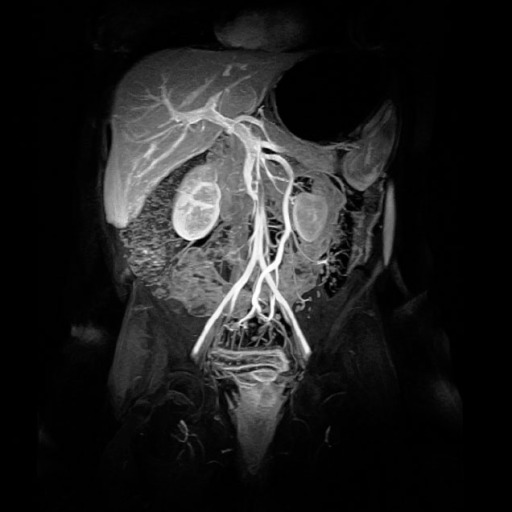
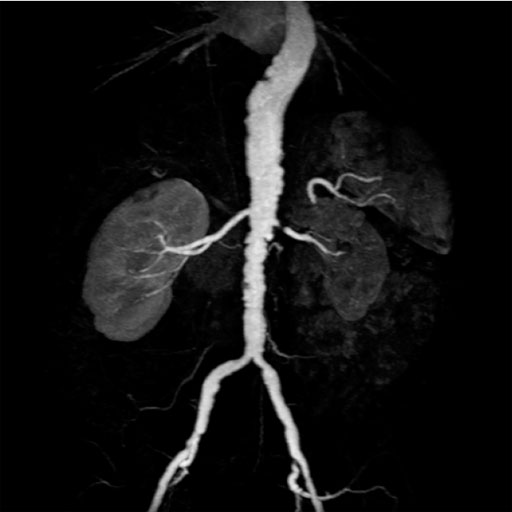
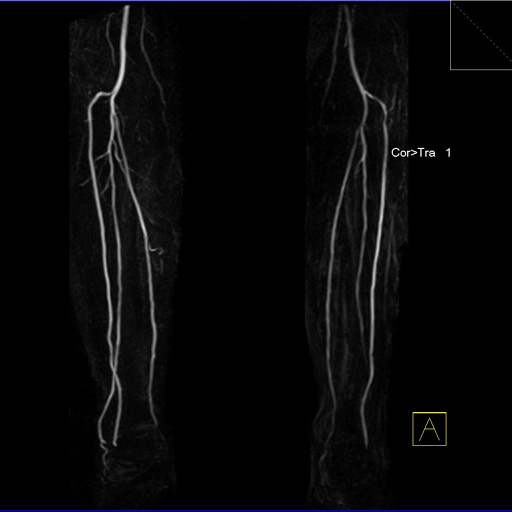
| Popliteal, anterior-posterior tibial and
peroneal arteries seen with syngo NATIVE |
VRT of the renal arteries with stenosis
generated from syngo NATIVE images |
Multi-step syngo NATIVE examination of the
pelvis and upper and lower legs vessels |
 |
 |
 |
| Stenosis of the renal artery of the kidney
transplant (right: ceMRA) |
Visualization of the lower leg vessels with
syngo NATIVE |
Coeliac, superior mesenteric and renal arteries
seen with syngo NATIVE |
Step by step:
syngo NATIVE: SPACE
1. Run the scout.
2. Open and position TDscout to calculate trigger time of
vessels of interest.
3. Ensure accuracy of ECG triggering and apply scan.
4. Open syngo NATIVE SPACE sequence and position of anatomy
of interest. Do not apply the scan yet.
5. Load TDscout cine images into the "Mean Curve" program to
calculate correct TD time.
6. Draw RoI over vessel of interest and "Start Evaluation".
7. Move the vertical bar to the beginning of the intensity
curve and use the Trigger Time as the TD within the
sequence.
Apply the scan.
syngo NATIVE TrueFISP
1. First, position the slices and Inversion pulse groups.
2. Locate and position the Navigator pulses on the dome of
the diaphragm. Page through the axial slices to ensure the
Navigator pulses do not overlap the renal arteries.
3. Set the captured cycle in the Physio parameter card.
4. The Navigator information can be viewed in the Inline
Display while scanning.
5. Load the 3D series into the 3D Task Card to perform
reconstructions.
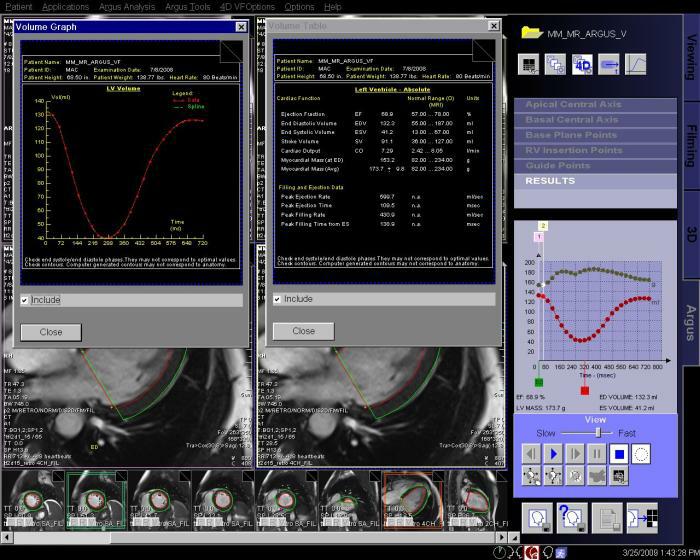
- Syngo inline VF: Ventricular function. Ejection fraction
calculation.
With syngo Inline VF you can perform fully automatic
volumetric assessment, ejection fraction calculation -
during the scan. The heart is located and the endo- and
epicardial borders are detected automatically. Data output
is right after the image reconstruction without any user
interaction.
Features
Scan is done with PACE multi-breath-hold protocols and syngo
Inline VF is directly integrated into the acquisition
sequence.
All cardiac phases are automatically segmented and the
smallest and largest volumes are assumed to be ES (End
Systolic) and ED (End Diastolic) phases.
Slices are acquired from base (at the level of mitral valve)
to apex.
Easy user guidance with graphical selection of ED, ES, basal
and apical slices.
Contour generation is done automatically.
Clinical Applications
Reliable and fast cardiac volumetric and ejection fraction
assessment in a busy, throughput oriented environment.
Automatic volumetric assessment and ejection fraction
calculation in cardiomyopathy (dilated, hypertrophic, etc.),
pericardial disease, cardiac tumors and cardiac transplants.
 |
 |
 |
| Shot axis view with outlined epicardial borders
generated automatically |
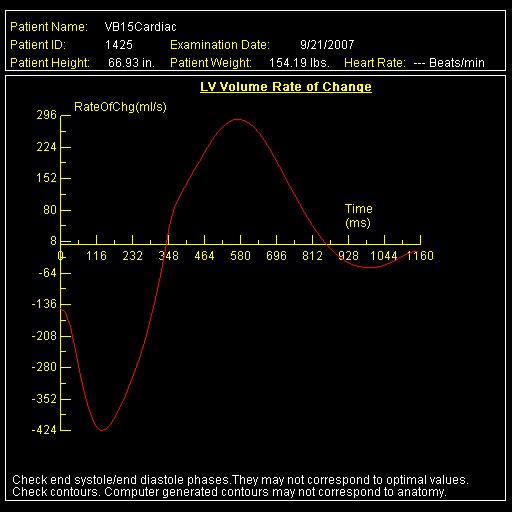
Diagram showing ventricular volume change
automatically generated with syngo Inline VF |
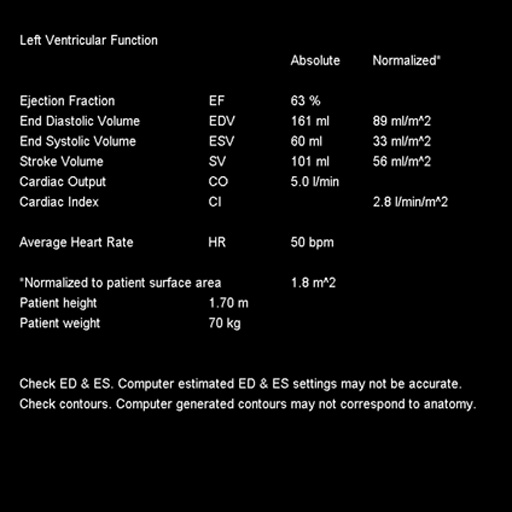
Result tables, automatically generated with
syngo Inline VF |
Step by step:
1. Locate Inline VF sequence in the Exam Explorer.
2. Inline VF is found in the Physio parameter card, within
the Cardiac tab.
3. The images are displayed in the Inline Display with
automatic contours as the images reconstruct.
4. Result tables are saved in the series folder in the
Patient Browser. The result tables can be viewed in the
Viewing Task Card.
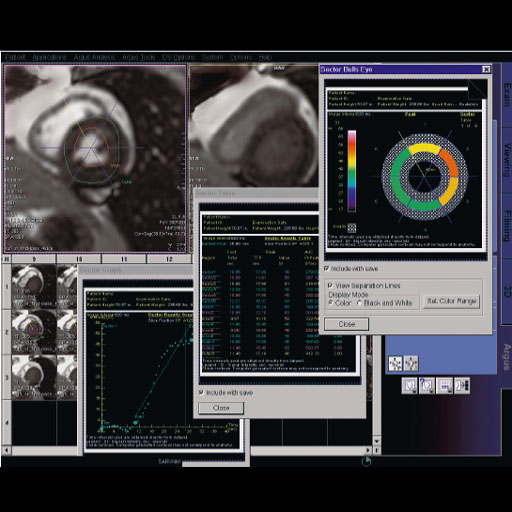
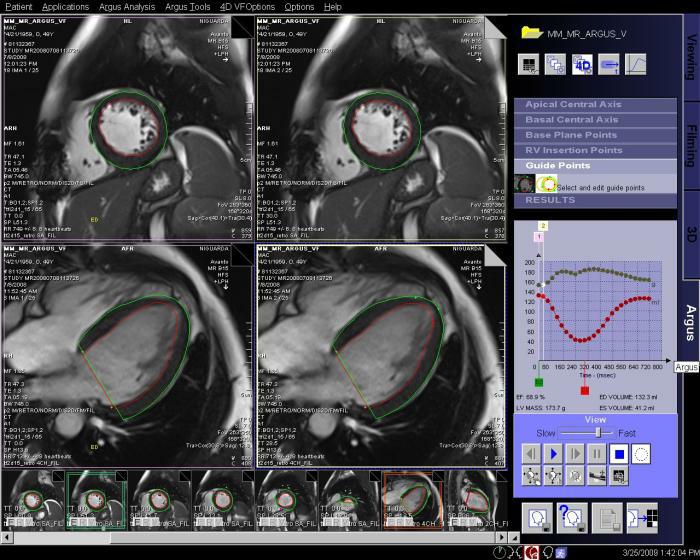
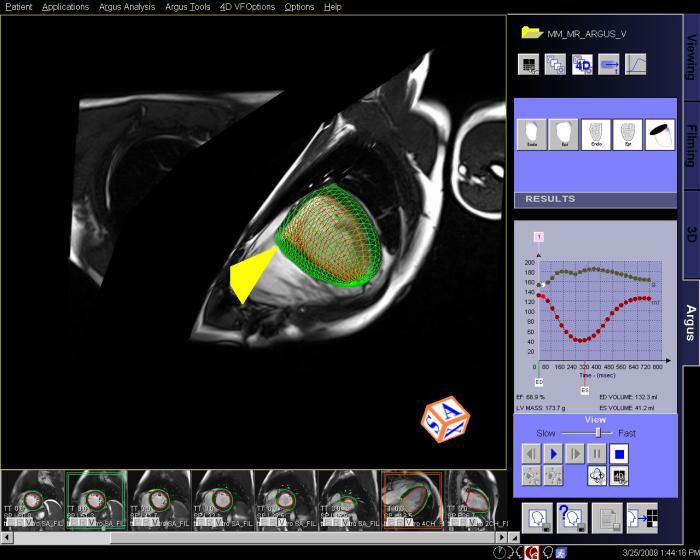
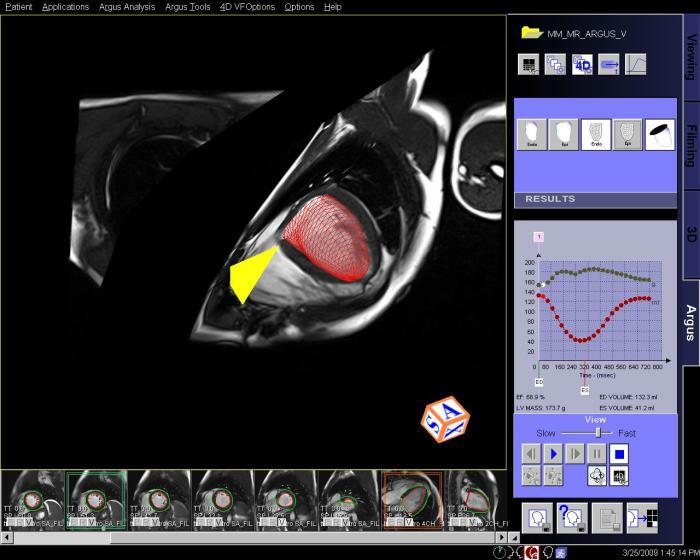
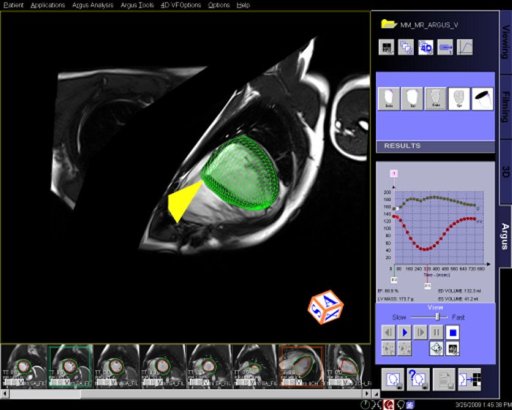
- Syngo Argus 4D VF:
With syngo Argus 4D VF, a typical ventricular function and
mass analysis can be done in less than a minute. This method
uses a heart model based algorithm instead of contour
tracing.
Features
A 4D model can be created with a few mouse clicks by
defining the center of the LV apex on an apical short-axis
cine, center of the LV base on a basal short-axis cine,
mitral valve insertion points on a 2- and/or 4-chamber plane
in diastole and systole.
The model-based algorithm provides within a few seconds the
appropriate endo- and epicardial contours on all slices and
phases as well as a summary table including various data for
volume, function and mass.
No missing ventricular volume nor additional atrial volume
deterioration due to cardiac phase adaptive 4D model.
Clinical Applications
Highly accurate volumetric assessment and ejection fraction
calculation in cardiomyopathy (dilated, hypertrophic, etc.),
pericardial disease, cardiac tumors and cardiac transplants.
Step by step:
1. Load cine cardiac study into Argus 4D Taskcard.
2. Place marker in center of the LV of the most
apical slice position.
3. Place marker in the center of the LV of the most
basilar slice position.
4. Place markers at the insertion points of the
mitral valve on a long axis view, at both end
systole and end diastole.
5. Adjust the markers for the position of the right
ventricular insertion points.
6. If necessary, adjust the endo and epicardial
contours.
7. View and save the ventricular results. |
 |
 |
| |
|
|
 |
 |
 |
| |
|
Interactive 3D model of the heart with
integrated epicardial surface depiction |
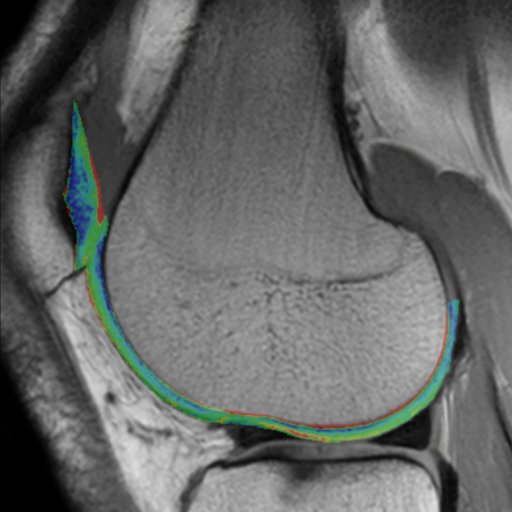
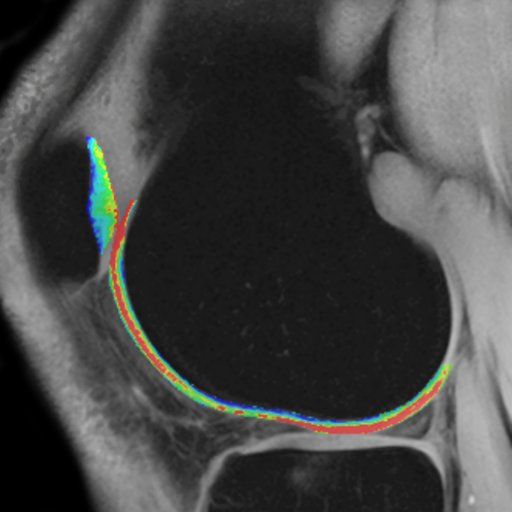
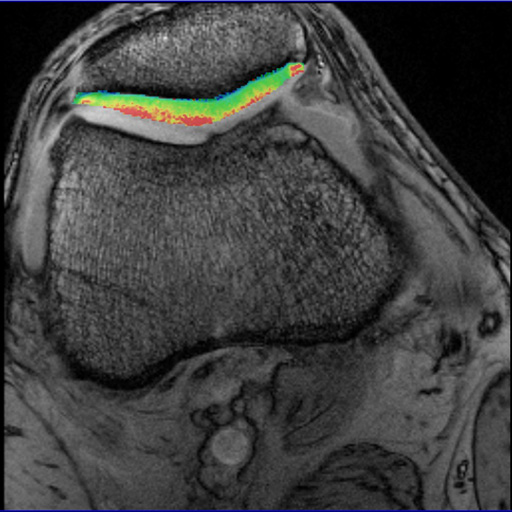
- Syngo MapIt: Provides the protocols and Inline
calculation of parametric maps of T1, T2, and T2* properties
of the imaged tissue. The application range includes
cartilage evaluation of joints, liver, kidney, prostate, and
more.
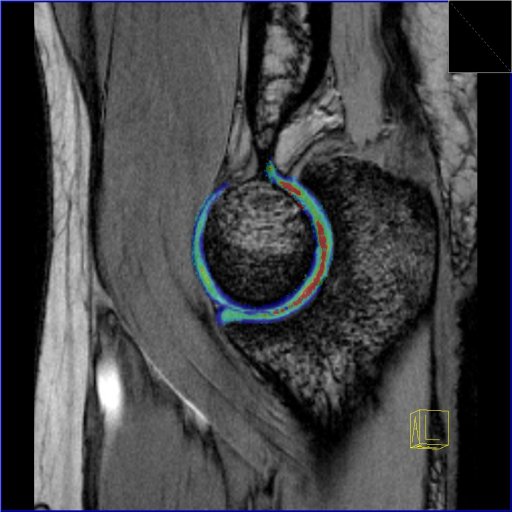
In particular, syngo MapIt supports the user in detecting
osteoarthritis of the joint based on the T1, T2, and T2*
properties of the cartilage.
• 3D VIBE sequence for Inline T1 mapping
• Multi-echo spin echo sequence for Inline T2 mapping
• Multi-echo gradient echo sequence for Inline T2* mapping
• Protocols for fully automated Inline parametric mapping
Clinical Applications
syngo MapIt allows the early detection of osteoarthritic
pathology based on the T1 and T2 and T2* properties of the
cartilage.
Cartilage transplant evaluation
It’s possible to use syngo Fusion to overlay these maps with
their corresponding anatomical image
 |
 |
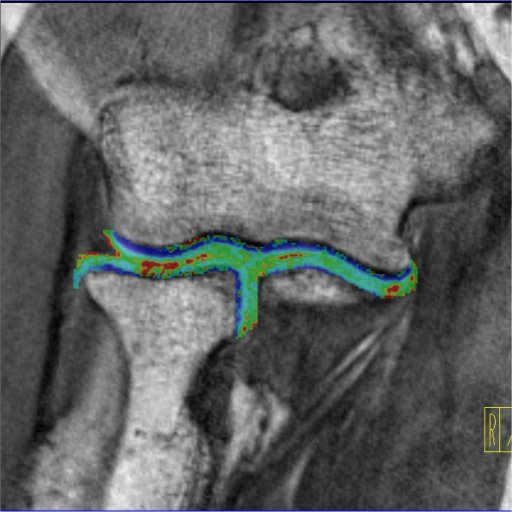 |
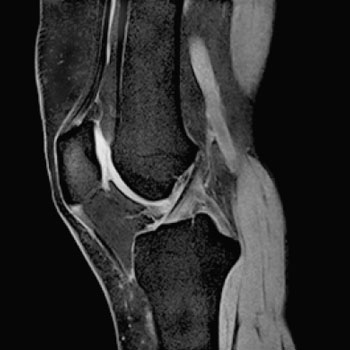
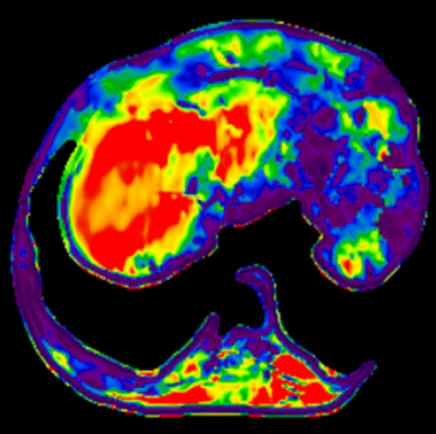
| Knee cartilage seen without syngo MapIt |
Knee cartilage seen with syngo MapIt |
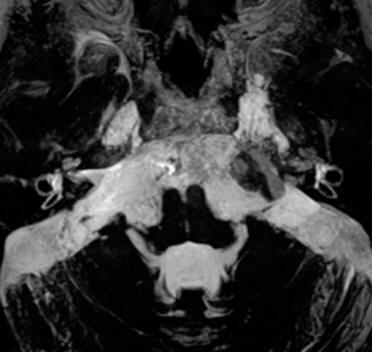
Cartilage visualization at elbow with syngo
MapIt |
 |
 |
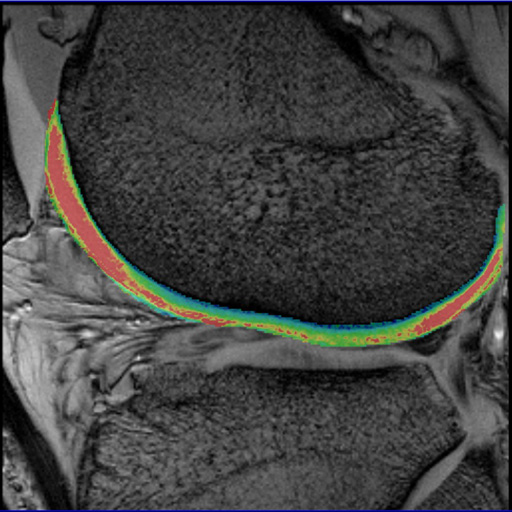 |
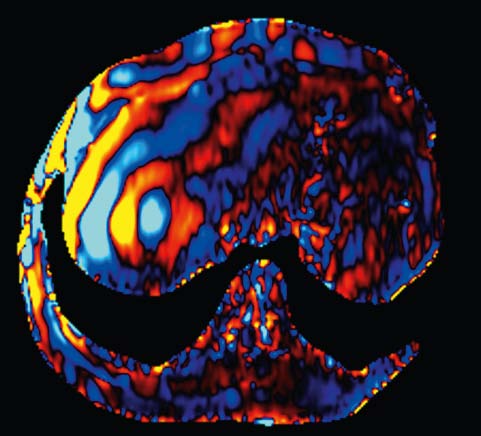
| Cartilage visualization at elbow with syngo
MapIt |
syngo MapIt showing patellar cartilage |
syngo MapIt shows degenerative changes of the
femoral cartilage |
step by step:
1. Open and position the T2* map scan. This is found in the
Knee, library MapIT section.
2. The MapIT parameters can be found on the Inline, MapIT
subtask card.
3. Apply the sequence.
4. The maps and original data can be reviewed in the Viewing
Task Card. The T2* baseline map window level needs to be set
to a default value. To set, change the window and center
values each to 30.
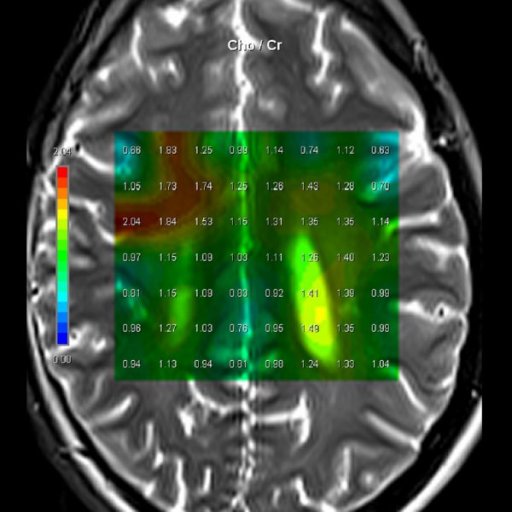
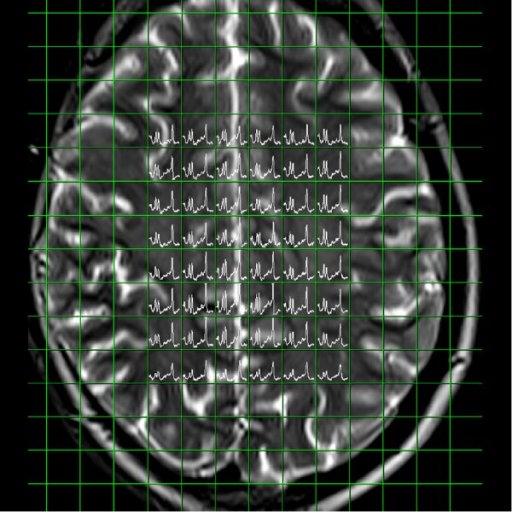
- 3D CSI (Chemical Shift Imaging):
Integrated multivoxel spectroscopy software package with
sequences and protocols for 3D Chemical Shift Imaging (CSI).
Features
Matrix Spectroscopy – phase-coherent signal combination from
several coil elements for maximum SNR with configurable
prescan-based normalization for optimal homogeneity
3D Chemical Shift Imaging
Hybrid CSI with combined Volume selection and Field of View
(FoV) encoding
Short TEs available (30 ms for SE, 20 ms for STEAM)
Automized shimming of the higher order shimming channels for
optimal homogeneity of the larger CSI volumes
Weighted acquisition, leading to a reduced examination time
compared to full k-space coverage while keeping SNR and
spatial resolution
Outer Volume Suppression
Spectral Suppression
Protocols for prostate spectroscopy
Clinical Applications
Prostate Spectroscopy for diagnosis, localization of
prostate cancer
Improved spatial localization of metabolic changes in biopsy
or radiotherapy planning
 |
 |
 |
| Cho/Cr ratio map generated from
3D CSI measurement |
Spectral nap generated from 3D
CSI measurement |
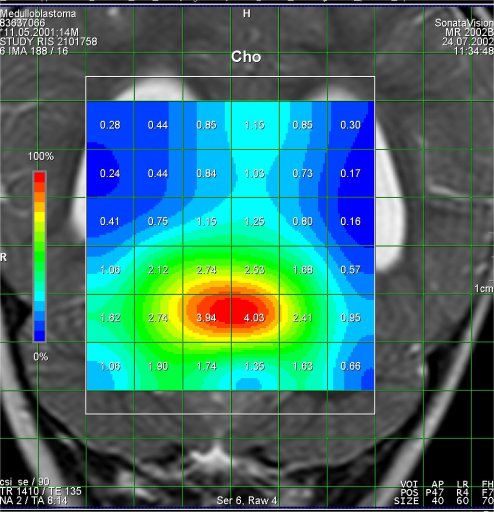
Increased Cho-signal in a
medulloblastoma case |
Step by step:
1. Perform imaging in all three planes to include the entire
brain. Open the csi 3D se 135 sequence. Located in the exam
explorer in the Spectroscopy, CSI, head region.
2. Scroll thru the transversal images for area of interest.
3. Copy image position. Right click on the selected
transverse image, from the menu select copy image position.
4. Go to the scroll drop down menu and select scroll
nearest. This will align the 3D VOI in all three
orientations.
5. Rotate the VOI inplane on the transversal image to cover
the area of interest.
6. Open toolbar, and and select create sat bands. Draw
saturation bands around all sides of the 3D VOI to remove
lipid signal from calvarium.
7. Select fully excited VOI, on the Geometry card.
Apply the sequence.
- Syngo BOLD Evaluation:
syngo BOLD Evaluation is the processing and visualization
package for Inline BOLD imaging.
Features
This package provides statistical map calculations from BOLD
datasets and enables the visualization of task-related areas
of activation with 2D anatomical data. This allows the
visualization of the spatial relation of eloquent cortices
with cortical landmarks or brain lesions
Additionally, evolving signal time courses in task-related
areas of activation can be displayed and monitored
Functional and anatomical image data can be exported for
surgical planning as DICOM datasets, additionally all color
fused images and results can be stored or printed
Statistical map generation: paradigm definition, calculation
of t-test maps
2D Visualization: fused display of fMRI results, color
t-test maps on anatomical datasets
Inline real time monitoring of the fMRI acquisition
Clinical Applications
Neurosurgical planning
Assess the effects of neurodegenerative diseases, trauma or
stroke on brain function
Brain mapping
| |
 |
| |
BOLD evaluation task card |
Step by step:
1. Load the ep2d_bold_moco series into the BOLD Evaluation
Task card. From the patient browser, select this series and
go to Applications and choose BOLD Evaluation.
2. Choose the moco filter 3D evaluation program.
Automatically the evaluation controller dialog box will
appear, when post processing BOLD data it is freely
selectable to choose filters or motion
3. Adjust the simple clustering to remove noise from BOLD
data. Increasing this value will remove any colored
clusteredpixels lower than this number. For example when
setting this value to 10 any value of activated (colored)
adjacent pixels less than 10 will be hidden from view.
4. Load the t1_se_tra sequence into segment 1. From the
patient browser select this sequence and drag and drop into
the upper left segment. This will fuse the BOLD data with
anatomic data
5. Scroll thru the images using the "dog ear tab" of segment
one. This will also move the fused anatomic and functional
slices.
6. Set the transparency of the functional data. Reducing the
Alpha Value will make the functional data more transparent.
7. Save the fused results. Go to patient, and select Save
All Alpha As... This will save all slice positions and allow
naming of the sequence, for easy access in the patient
browser.
This series can now be viewed in the viewing card or sent
via PACs for reading
- Inline BOLD Imaging: Examination of intrinsic
susceptibility changes in different areas of the brain,
induced by external stimulation (e.g. motor or visual).
Automatic real-time calculation of z-score (t-test) maps
with Inline Technology, for variable paradigms.
• Compatible with single-shot EPI with high susceptibility
contrast for fast multi-slice imaging
• ART (Advanced Retrospective Technique) for fully automatic
3D retrospective motion correction, for 6 degrees of freedom
(3 translations and 3 rotations)
• Mosaic images for efficient storage and transfer of large
data sets
• 3D spatial filtering
• Inline calculation of t-statistics (t-maps) based on a
general linear model (GLM) including the hemodynamic
response function and correcting for slow drifts
• Overlay of inline calculated statistical results on the
EPI images
Clinical Applications
Neurosurgical planning
Assess the effects of neurodegenerative diseases, trauma or
stroke on brain function
Brain mapping
 |
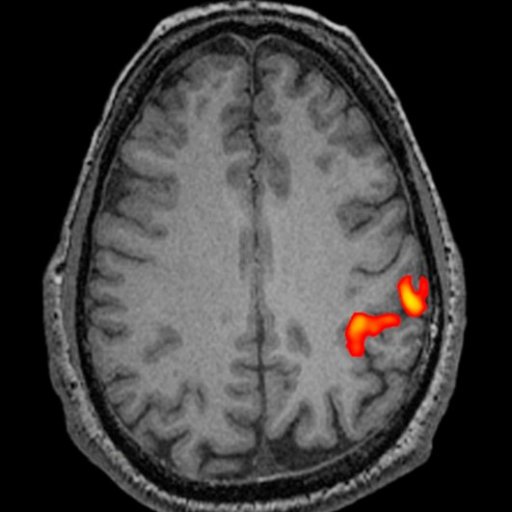 |
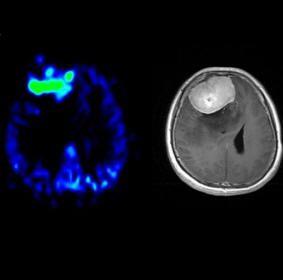
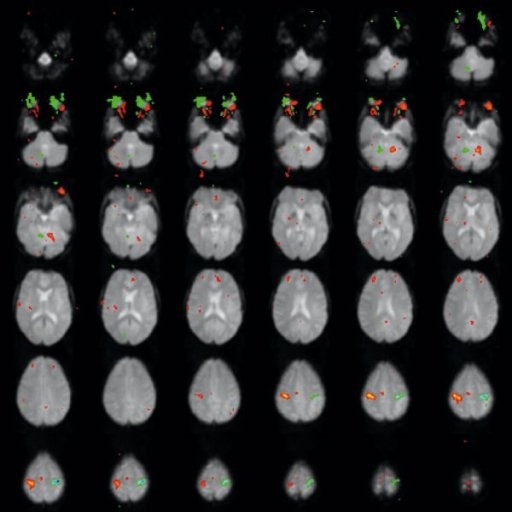
| Activation map superimposed on
original BOLD images |
Motor activation measured by fMRI
fused with 3D MPRAGE |
Step by step:
1. Load the bold-imaging program into the measurement queue.
The program is in the exam explorer located under: Head,
programs, bold-imaging.
2. Position the t1_se_tra to cover the entire head, and
apply the scan.
3. Open the remaining sequences and copy parameters to the
t1_se_tra. This will ensure all scans will have exact slice
positions.
4. Add open inline display to the ep2d_bold_moco sequence
properties. To do this right click on the sequence, go to
properties, AutoLoad, check the open inline display.
5. Give a verbal command to begin finger tapping with one
hand and start the BOLD exam. The scan is comprised of 60
measurements; the first 10 measurements will be with this
hand.
6. When the first 10 measurements are completed then give
the command to switch hands and tap these fingers for 10
measurements.
7. Repeat alternating finger tapping for remaining sets of
10 measurements, until the exam is complete.
The functional statistics can be visualized as the exam is
performed in the online display window.
- 3D PACE (Prospective Acquisition CorrEction): enhances
Inline BOLD imaging with motion correction during the
acquisition of a BOLD exam. In contrast to a retrospective
motion correction that corrects previously acquired data,
the unique 3D PACE tracks the head of the patient,
correcting for motion in real time during the acquisition.
This increases the data quality beyond what can be achieved
with a retrospective motion correction. As a result the
sensitivity and specificity of BOLD experiments are
increased.
• Fully automatic 3D prospective motion correction during
data acquisition, for 6 degrees of freedom (3 translations
and 3 rotations)
• Motion correction covering the complete 3D volume
• Provides high accuracy
• Substantially reduced motion-related artifacts in t-test
calculations
• Significantly increased signal changes in the activated
neuronal volume
• Increased functional MRI (fMRI) sensitivity and
specificity
| |
 |
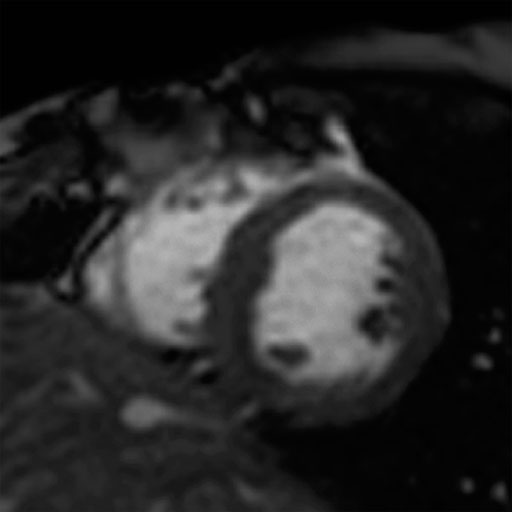
| |
fMRI with 3D PACE for improved detection of the
BOLD signal |
Step by step:
1. Locate a BOLD sequence in the Exam Explorer and go to the
BOLD parameter card.
2. When the Motion Correction option is activated, syngo
motion correction is performed during the calculation.
3. Small patient movements may cause significant artifacts
in the functional information. 3D motion correction can
reduce relative movements between measured data sets.
- Syngo DTI: Acquisition of data sets with
multi-directional diffusion weighting to assess anisotropic
diffusion properties of brain tissue
• Measurement of up to 256 directions of diffusion weighting
with up to 16 different b-values
• Inline calculation of the diffusion tensor
• Inline calculation of Fractional Anisotropy (FA) maps
(grey-value as well as color-coded for principle diffusion
direction), Apparent Diffusion Coefficient (ADC) maps and
trace-weighted images based on the tensor
- Multiple Direction Diffusion Weighting (MDDW) Diffusion
tensor imaging measurements can be done with multiple
diffusion-weightings and up to 12 directions for generating
data sets for diffusion tensor imaging.
- Flow Quantification : Special sequences for quantitative
flow determination studies
• Non-invasive blood / CSF flow quantification
• ECG Triggered 2D phase contrast with iPAT support
• Retrospective reconstruction algorithms for full R-R
interval coverage
- Interactive Realtime Sequences and hardware for
interactive real-time scanning
Uses ultra-fast Gradient Echo sequences for high image
contrast
Real-time reconstruction of the acquired data
The user can navigate in all planes on-the-fly during data
acquisition
• Real-time cardiac examinations
• Real-time interactive slice positioning and slice
angulation for scan planning
- Single Voxel Spectroscopy: Integrated software package
with sequences and protocols for proton spectroscopy.
Streamlined for easy push-button operation
• Matrix Spectroscopy – phase-coherent signal combination
from several coil elements for maximum SNR based on the Head
/ Neck 20
• Spectral suppression (user definable parameter) to avoid
lipid superposition in order to reliably detect e.g. choline
in the breast
• Up to 8 regional saturation (RSat) bands for outer volume
suppression can be defined by the user.
• Physiological triggering (ECG, pulse, respiratory or
external trigger) in order to avoid e.g. breathing
artifacts. Clinical application: brain, liver, neck soft
tissue, spine
SVS Techniques SE and STEAM
• Short TEs available
• Fully automated adjustments including localized shimming
and adjustment of water suppression pulses
• Also available: Interactive adjustments and control of
adjustments
• Optimized protocols for brain applications
- syngo CSI 2D: Chemical Shift Imaging: Integrated
software package with sequences and protocols for Chemical
Shift Imaging (CSI)
Extension of the Single Voxel Spectroscopy (SVS) package,
offering the same level of user-friendliness and automation
• Matrix Spectroscopy – phase-coherent signal combination
from several coil elements for maximum SNR with configurable
prescan-based normalization for optimal homogeneity
• 2D Chemical Shift Imaging
• Hybrid CSI with combined volume selection and Field of
View (FoV) encoding
• Short TEs available (30 ms for SE, 20 ms for STEAM)
• Automated shimming of the higher order shimming channels
for optimal homogeneity of the larger CSI volumes
• Weighted acquisition, leading to a reduced examination
time compared to full k-space coverage while keeping SNR and
spatial resolution
• Outer Volume Suppression
• Spectral Suppression
• Semi-LASER sequence available for CSI examination of the
brain
Protocols for head spectroscopy
Clinical Applications
Tumoral pathologies
Demyelinizing pathologies
Infectious diseases
Metabolic pathologies
Epilepsy
Degenerative diseases
|
 |
 |
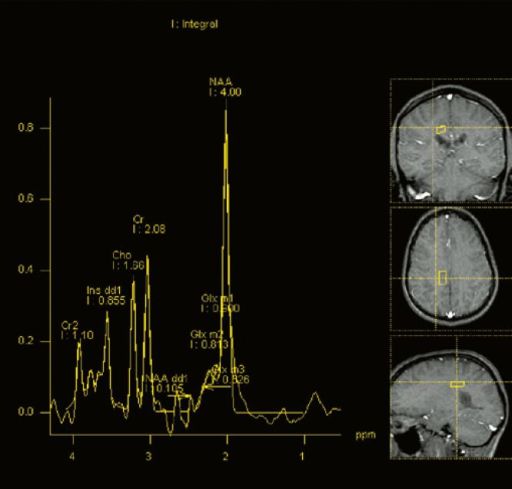
| Example for spectral
quality in the head, deriving from a 2D CSI
measurement |
Step by step:
1. Set up multi-planar localizers
2. Acquire in-plane T2 Axial localizer
3. Position 2D CSI Slab
4. Use Scroll>Nearest to find the reference image best
suited to the area of interest.
5. Apply the 2D CSI sequence
6. Double click the raw data icon to load the spectroscopy
data into the Spectroscopy Task Card
7. Acquire spectral data within the Volume of Interest (VOI)
- syngo CSI: Chemical Shift Imaging: Integrated
software package with sequences and protocols for Chemical
Shift Imaging (CSI) Extension of the SVS package, offering
the same level of user-friendliness and automation
• Matrix Spectroscopy – phase-coherent signal combination
from several coil elements for maximum SNR with configurable
prescan-based
normalization for optimal homogeneity
• 3D Chemical Shift Imaging
• Hybrid CSI with combined volume selection and Field of
View (FoV) encoding
• Short TEs available (30 ms for SE, 20 ms for STEAM)
• Automated shimming of the higher order shimming channels
for optimal homogeneity of the larger CSI volumes
• Weighted acquisition, leading to a reduced examination
time compared to full k-space coverage while keeping SNR and
spatial resolution
• Outer Volume Suppression
• Spectral Suppression
• Protocols for prostate spectroscopy
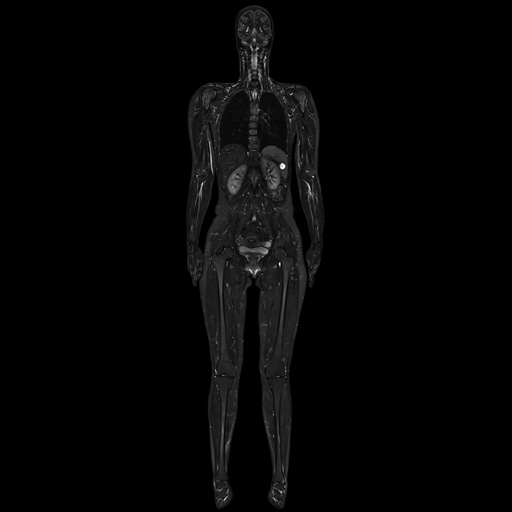
- Composing:
Composing of images from different table positions to show
the complete anatomy such as whole body, whole spine, etc.
Features
Automatic and manual composing of sagittal and coronal
images
Dedicated algorithms for spine, angiography, and adaptive
composing algorithms
Measurement on composed images (angle, distance)
|
 |
 |
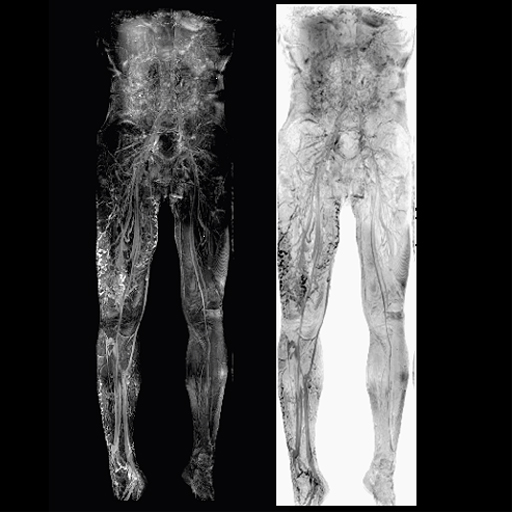
 |
|
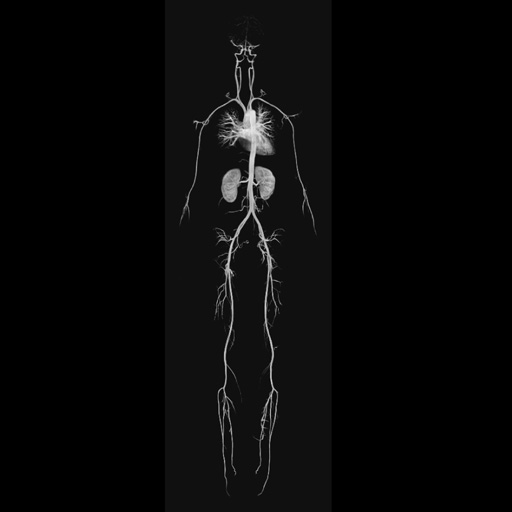
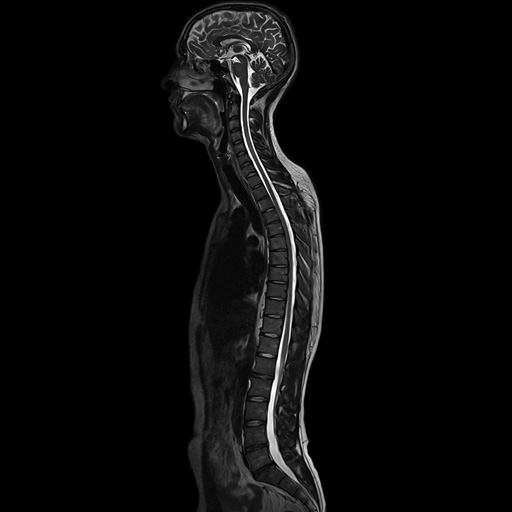
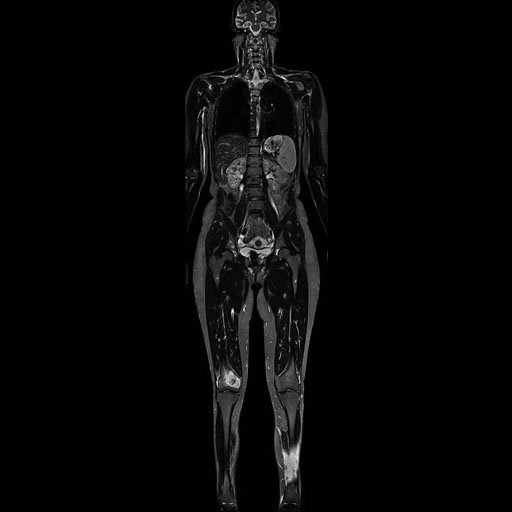
Composed coronal whole-body TIRM
scan |
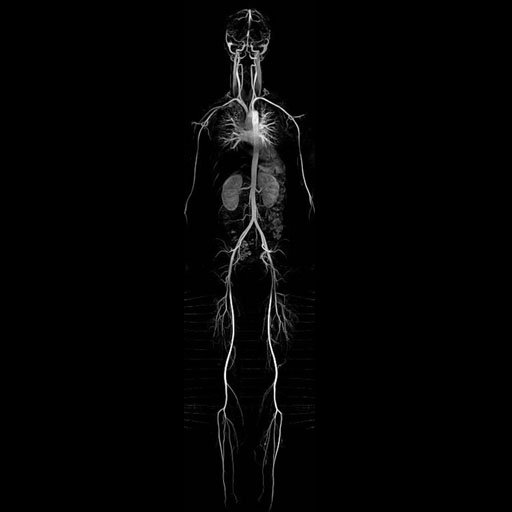
Composed whole-body MRA (MIP) |
Composed sagittal whole-spine
examination |
Step by step:
1. Send images from the Patient Browser to the Composing
Task Card.
2. Select the appropriate Composing algorithm. The Spine
algorithm uses bone structures in the images as a basis,
while Angio uses the vascular structures.
3. It is important when saving the images that all of the
images are saved. This is done by selecting Patient from the
main menu, then “Save All As…”
4. The final step is to name the series what you want it to
be called in the Patient Browser. Enter the name for the new
series in the text box, then select OK.
- TimCT Oncology:
syngo TimCT Oncology uses a sophisticated patient table with
excellent position accuracy and a RF shielded table drive as
well as Tim (Total imaging matrix) technology: at the same
time, local coils with high signal-to-noise ratio (SNR)
covering the whole body enable superb image quality and very
fast imaging using integrated Parallel Acquisition
Techniques (iPAT).
syngo TimCT Oncology is based on axial 2D multi-slice
sequences for both T1-weighted FLASH and T2-weighted TSE
imaging. The TSE variant can also be combined with syngo
BLADE for motion insensitivity. The FLASH variant can also
be combined with DIXON to acquire inphase, opposed-phase,
water and fat images in one measurement.
syngo TimCT Oncology allows a CT-like MR examination:
Definition of start point and end point of scan area only
No need to plan in multiple steps
No need to plan overlapping areas
No delay, no measurement pauses during table move
No need for composing
- Syngo Expert-i: Interactive real-time access to imaging
data and exam information from any PC within the hospital
network during the MR exam.
Until now, radiologists or other experts had to stop what
they were doing and go to the MR scanner to see the acquired
images, help with the scan set-up, or answer an open
question.
Now, questions can be addressed quickly and efficiently via
remote PC.
Benefits of syngo Expert-i
• Excellent results right from the first examination
• Streamlined workflow and faster patient throughput
• Reduced repeat rates with a check on images while the
patient is still in the examination room
• Reduced training effort by enabling expert assistance for
specialized procedure
- syngo Remote Assist
Direct computer link to the local Siemens service department
or the Siemens service centers (via router with telephone
connection)
Image transfer for further evaluation
• Image and file transfer in batch mode
• Reading of entries in the error logbook
• Remote trouble shooting
• Remote access to service manuals written in easy-to-use
HTML format
• Remote access to Service Site Database
• Start of preventive maintenance and quality assurance
routines. Provided in conjunction with a service contract
with Siemens (UPTIME
Services)
• Remote access granted only with permission of the
institution. Data security is ensured by secure access
- IDEA Integrated Development Environment for Applications
Extensive programming environment used to create and modify
pulse sequences, offering a maximum of flexibility
Based on C++ for Windows XP. Sequences and RF pulses are
displayed in a visual interface
Features
• Allows direct access to the Image Calculation Environment
(ICE), and to all protocols
• Testing the generated code is extensively supported by the
debugger and the simulation program
• IDEA is also usable on any standard PC with operating
system Windows XP Windows 7 Pro,
making developments independent of the MR system
Processing plug-ins For development or modification of
user-defined image processing steps which may be integrated
into the measurement protocols
• Individual processing is secured by a number of functions
(e.g. TTP and MTT), useful for neuro or perfusion imaging
Prerequisite IDEA training course
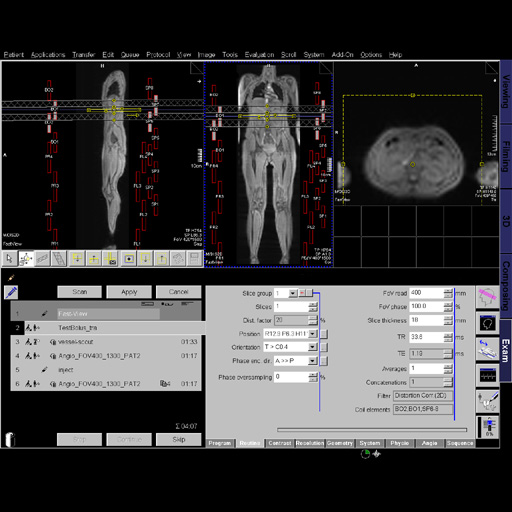
- Tim Planning Suite:
Easy planning of extended Field of View examinations in an
efficient way using Set-n-Go protocols.
It allows planning of several stations at once e.g. on
composed localizer images.
The overlap of slice groups can be adjusted. All stations
can have independent parameter settings although they are
displayed together.
A special coupling mode allows easy positioning of all
stations at once according to the patient’s anatomy.
Fully supports scan@center and Phoenix functionality.
Tim Planning UI with optimized layout for slice positioning
Ready to use Set-n-Go protocols for different clinical
questions
Integrated toolbar for fast, advanced slice planning:
FoV-Plus, FoV-Minus, AlignParallel, AlignFieldOfViews
| |
 |
| |
User interface of the Tim Planning Suite for
easy planning of extended Field of View examinations |
Step by step:
1. Location on protocols in Exam Explorer
2. Set-n-Go: supports in preparing the measurement and
examining large regions of the body.
3. Inline Compose: automatic composing of images from
divided examination regions.
4. Position local slices on composed image
5. Coupled Graphics: Allows all graphical slice positions in
all orientations within one scan to be moved at the same
time.
6. Auto Coil Select: All surrounding coils are selected
automatically. The maximum number of coils used is limited
by the number of system channels.
7. Set-n-Go Parameters
Viewing images in Viewing Task Card
- TimCT Angiography: Maximum FoV of Syngo TimCT
Angiography: 205 cm.
syngo TimCT Angiography employs the revolutionary TimCT
Continuous Table move technology for large Field of View
angiographies with the smoothest workflow and the most
homogeneous image quality.
syngo TimCT Angiography is built on the Tim technology as
well as on a highly advanced patient table with high
positioning accuracy and a RF shielded table drive.
syngo TimCT Angiography uses a coronal 3D gradient echo
TimCT sequence with strong T1-weighting and high SNR.
Optimized protocols for peripheral vessel runoff exams allow
for CT-like scanning with MR: Just define start & end of the
scan range. No need to plan multiple steps. No need to plan
overlapping sections.
No lost time due to inter station table move. No need to
compose images.
Thanks to the streamlined and automated workflow and the
fast acquisition time with syngo TimCT, a peripheral vessel
runoff exam can be performed in less than 15 minutes with
the most homogeneous image quality.
Features
iPAT compatibility utilizing Tim‘s Matrix coils capabilities
Inline subtraction and Inline MIP of complete peripheral
runoff images
Highest image homogeneity and no boundary artifacts thanks
to seamless TimCT scanning
Maximum FoV of syngo TimCT Angiography: 205 cm
Fast table speed during angiographic measurements up to 50
mm/ s
Fast examination time (typically below 1 minute) for TimCT
peripheral angiographic exam
(40–70 s depending on resolution)
 |
 |
| Arteriovenous
malformation of the lower right extremity |
Step by step:
1. Load TimCT Angio Program into the measurement queue. The
patient should be positioned head first in the scanner,
centering at the level of the patients shoulders.
2. The TimCT fastview scout will run automatically. It can
be viewed as it is acquiring the data in the online display.
When the scan is complete, inline it will MPR into all 3
orientations.
3. Position and apply the test bolus scan. After applying a
pause menu will appear, this will allow for simultaneous
start of the scan and injection of a test bolus. Calculate
the contrast arrival time. This will be used later.
4. Position and apply the vessel scout protocol. This is a
set-n-go scan for visualization of the peripheral vessels,
which will be used to position the angio sequence.
5. Position the TimCT angio pre scan. This is used for the
inline subtractions of the post TimCT Angio scan. The post
scan will automatically copy the same position.
NOTE: Ensure all vessels are in the same plane, as this scan
is one FoV, it cannot be angled.
6. Input contrast agent information on the injection pause
menu. Start your injection and scan delay based on
calculations from the test bolus scan, and select continue.
7. Subtraction images and the post TimCT Angio scan will
reconstruct inline along with a coronal MIP. This data can
now be loaded into the 3D Task card for additional post
processing.
- iPAT Extensions: Allows iPAT in 2 directions
simultaneously (phase encoding direction and 3D direction
for 3D sequences). By applying PAT in 2 directions
simultaneously, the effective PAT factor can be maximized,
and PAT applications are extended.
Clinical Applications:
MR Angiography
Ultra-fast isotropic T1-weighted 3D imaging of the head
Whole abdomen, thorax imaging (e.g. MR Colonography)
Step by step:
1. Open a 3D scan.
2. Go to the resolution tab, then the iPAT sub tab.
3. Set the iPAT Extensions by changing the acceleration
factor 3D.
4. The maximum factor is based on the coil elements in the
3D partition direction.
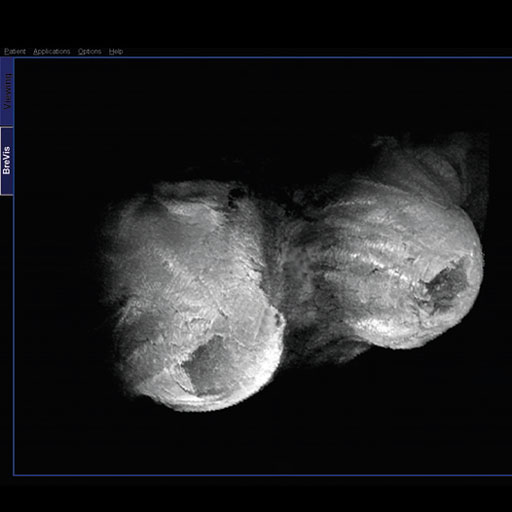
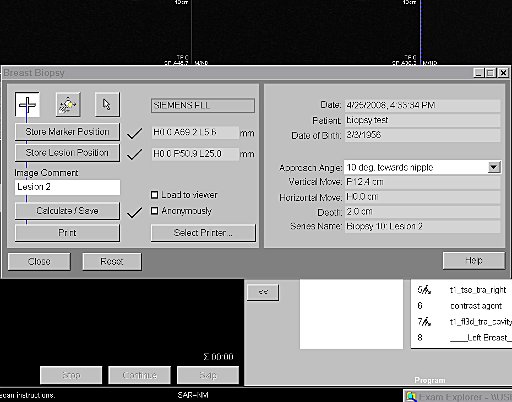
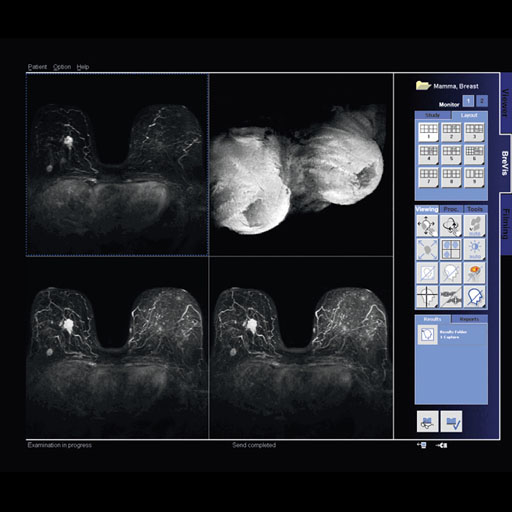
- Syngo BreVis: The system is equipped with standard
BIRADS (Breast Imaging Reporting and Data System) with NORAS
BI 320.
Accuracy, speed, and efficiency are essential when it comes
to interpreting soft tissue examinations as well as
performing biopsies. Siemens syngo® workplaces (e.g.
MultiModality WorkPlace) are equipped with a great number of
computer-aided tools such as syngo BreVis for real-time
analysis and syngo BreVis Biopsy for interventional
procedure planning.
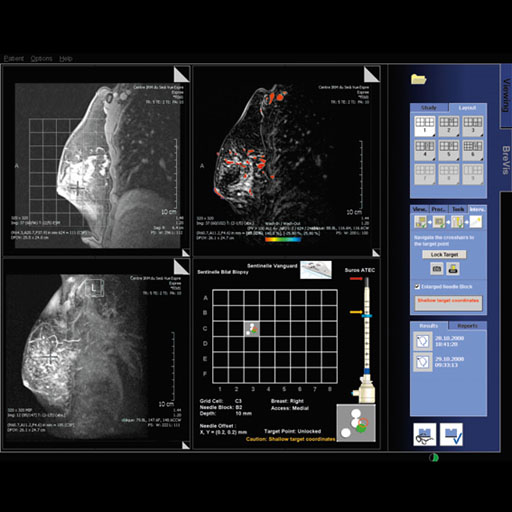
syngo BreVis is easy-to-use, fast, and reliable. Quick
pre-processing and precise motion correction enable
efficient breast reading and reporting. This flexible tool
provides various functionalities – such as customized
layouts and the ability to display and compare MR images
with correlating ultrasound or X-ray mammography images.
Additionally, the system is equipped with standard BIRADS
(Breast Imaging Reporting and Data System) Reporting,
Auto-Subtraction and Auto-MIP, elastic image correction in
case of patient movement, curve evaluations, color overlay
maps and the calculation of lesion volumes.
- Syngo GRAPPA: Based on k-space. Faster high resolution
protocol for wide fields.
syngo GRAPPA is a Parallel Imaging Technique, based on
k-space which can be used to shorten the acquisition time or
increase the spatial resolution in the same examination
time.
Features
syngo GRAPPA works better with linear array coils like
"Spine Coil"
syngo GRAPPA can be used with small Field of View
High SNR of Tim matrix coils allows to trade speed for SNR
for more applications
Clinical Applications
Faster neuro imaging (Spine, head…)
Cardiac imaging with high temporal and spatial resolution
Fast dynamic contrast enhanced MR Angiography
Abdominal Imaging with shorter breathhold times
Fast, high resolution orthopedic imaging
Fast whole-body imaging |
 |
 |
| Left temporoparietal tumor, seen with isotropic
SPACE (syngo GRAPPA 2.4 min) |
syngo GRAPPA 2, 2.56 min, SL 3 mm. 448 matrix. (
right syngo GRAPPA, left conventional images. 5 min) |
 |
 |
 |
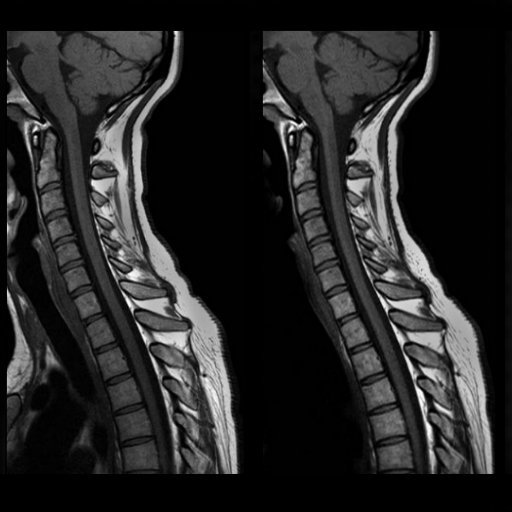
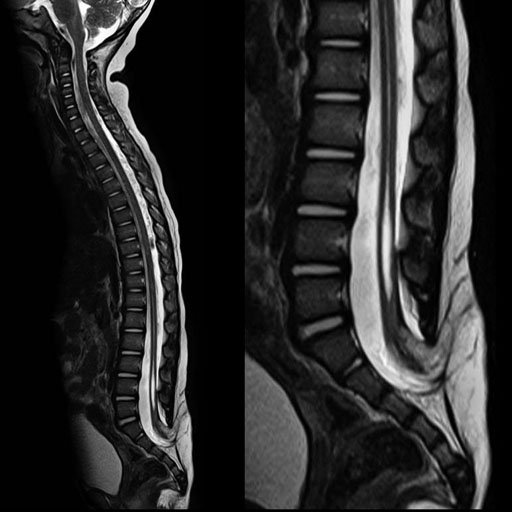
| Syringomyelia and tethered cord. age 22 months.
syngo GRAPPAx2(45 sec. 418 matrix.3mm) |
T2w TIRM for metastases screening, syngo GRAPPA,
PAT 3(2.00 min per step 6 mm. 5 steps) |
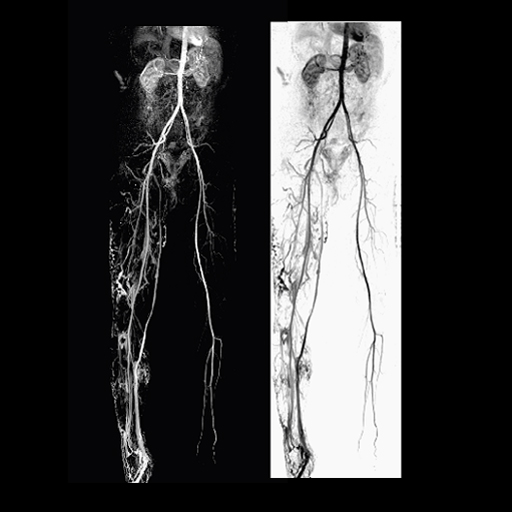
Whole-body MRA in 48 seconds, syngo GRAPPA x3
(1.3x1.3 mm resolution, 4 steps at 12 s/step) |
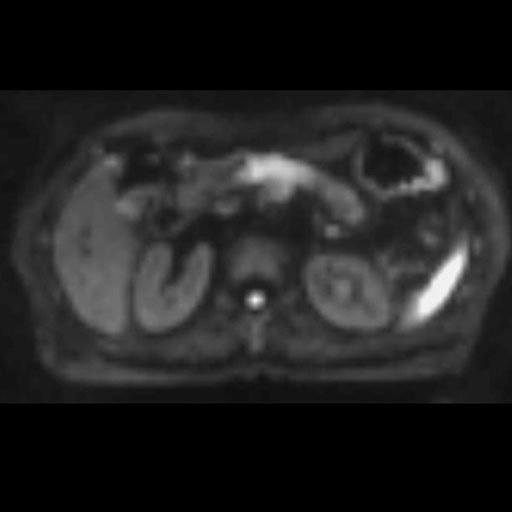
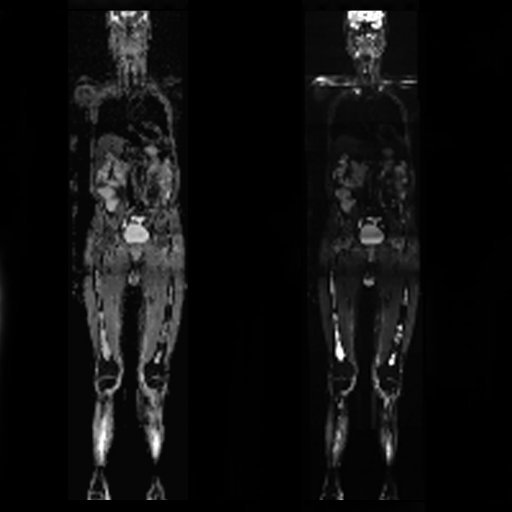
- Syngo REVEAL: Reduce susceptibility artifact when
combined with GRAPPA. Excellent for mts. syngo REVEAL is an
echo planar imaging (EPI) based diffusion weighted imaging
technique for the body. This sequence can be combined with
2D PACE navigator technique to decrease motion artifacts.
Features
Combined with GRAPPA for reduced susceptibility artifacts
Typically high b-values (600-1000) for signal suppression of
normal tissue
Dark-Vessel REVEAL with low b-values (50)
Semi-quantitative REVEAL (ADC maps)
Clinical Applications
Can be useful in differential diagnosis of benign versus
malignant lesions in all anatomical regions (Liver,
pancreas, lymph nodes, pelvis …)
 |
 |
 |
 |
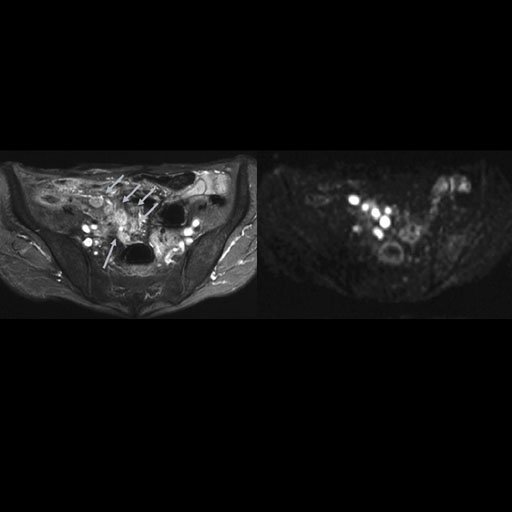
Free breathing syngo REVEAL with 2D PACE
provides improved image quality
in abdomen imaging |
Malignant infiltration of iliac lymph nodes,
seen with syngo REVEAL |
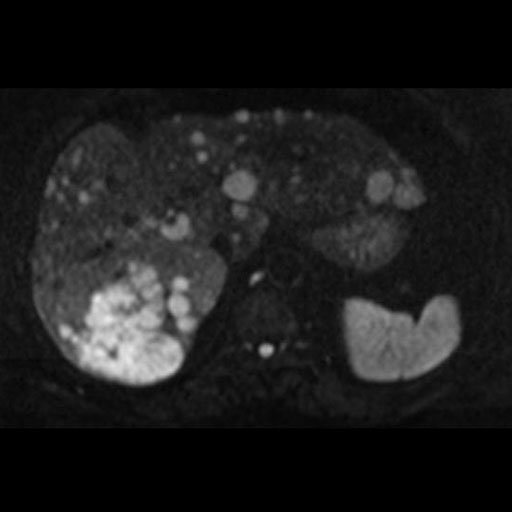
Pancreatic cancer detected by syngo Reveal |
Coronal MPR of a whole-body DWI examination in
case of multiple myeloma
(right b=50 mm/s2 image left ADC map |
- Syngo Security: Security package for general regulatory
security rules
The option supports customers to achieve compliance with
HIPAA (Health Insurance and Accountability Act)
• User authentication
• Restricts access to functions and data through privileges
and permissions
• Logs relevant data security information in audit trail
- Syngo SPACE: syngo SPACE sequence is single slab
3D TSE sequence with slab selective, variable excitation
pulse.
This sequence enables acquisition of high resolution 3D
datasets with contrasts similar to those obtained from 2D
T2-weighted, T1-weighted, proton density and dark fluid
protocols at 1.5T and 3T within a clinically acceptable
timeframe and without SAR limitations.
Features
When you combine syngo SPACE with Tim’s Parallel Imaging
(SENSE and GRAPPA), you can acquire high-resolution 3D
images within a shorter timeframe.
3D isotropic data set allows retrospective reformatting to
view multiple orientations of the anatomical area being
examined.
Low SAR
Clinical Applications
Brain survey to visualize minute lesions with 3D scanning
(e.g. Multiple sclerosis, cranial nerves)
MR cholangiopancreatography with navigator
based SPACE
Pelvic diseases
High resolution proton density weighted images of the knee
- Argus Function: Automated tool for cardiac function
evaluation.
Features
Fully automatic image segmentation
Easy user guidance with graphical selection of ED, ES, basal
and apical slices
Global function and regional wall motion analysis with color
results
Clinical Applications
Volumetric assessment and ejection fraction calculation in
cardiomyopathy (dilated, hypertrophic...), pericardial
disease, cardiac tumors and cardiac transplants.
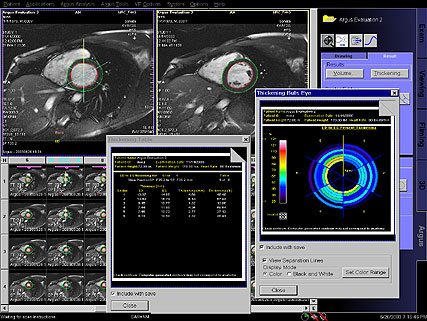 |
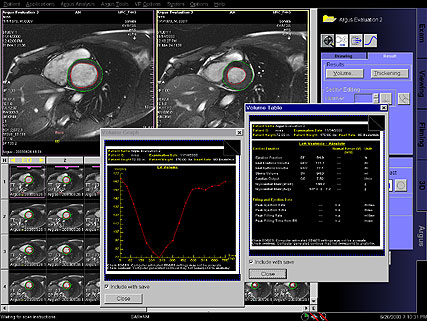 |
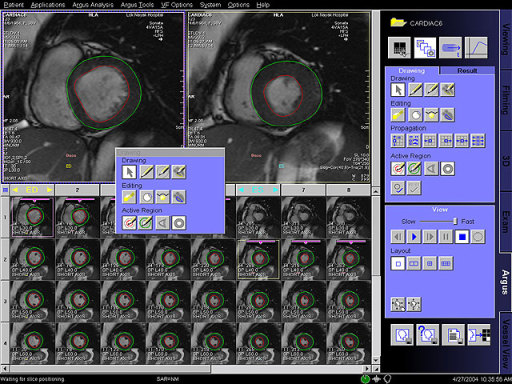 |
.jpg) |
| Semi-automated Argus
Function cardiac output results are shown |
Step by step:
1. From the patient browser, load all short axis cine series
into Argus Viewer.
2. Select the "Ventricular Function" Icon within Argus
3. Select the "Auto Adjust" tool to have the myocardial
contours drawn on the basilar end diastolic (ED) image.
4. Next select "Propagate ED". This will contour all images
in the ED phase column for all slice positions.
5. Select "Propagate ED to ES" to have contours moved to the
End Systolic phase column for all slice positions.
6. Complete the post-processing by "Accepting ED/ES Phases"
and "Accepting Contours". You are now ready to produce the
results.
7. Go to the Results Tab and select "Volume" to view the
results. Storing the ventricular analysis can also be
accomplished by selecting "Save As"
-
Advanced Cardiac:
Special sequences and protocols for advanced cardiac
imaging including 3D and 4D syngo BEAT functionalities.
It allows comprehensive exams covering morphology, function,
dynamic imaging, tissue characterization, coronary imaging,
plaque characterization and more.
Features
1-click change from FLASH to TrueFISP for easy contrast
optimization, 1-click to switch arrhythmia rejection on/off,
1-click change from Cartesian to radial sampling to increase
effective image resolution (e.g. in pediatric patients) and
avoid folding artifacts in large patients, 1-click switch
from cine imaging to tagging for wall motion evaluation,
1-click switch from 2D to 3D imaging, syngo BEAT
automatically adjusts all parameters associated with the
changes.
Clinical Applications
Ventricular function and regional wall motion evaluation:
Retrospectively triggered TrueFISP with iPAT for full
coverage of the cardiac cycle, T-PAT with GRAPPA for highly
accelerated image acquisition, arrythmia rejection for
patients with extrasystoles. 3D cine imaging, complete
coverage of the heart in just one go. Visualization of
myocardial contractility using various tagging techniques.
Cardiac and vessel morphology: High resolution
morphological imaging using bright- and dark-blood sequences
with free breathing. Multiple contrasts such as T1- and
T2-weighted imaging for use in diseases such as myocarditis
(inflammation/hyperaemia), ARVD (fibrous-fatty degeneration)
or acute myocardial infarction (edema).
Dynamic myocardial imaging with syngo BEAT:
Ultra-fast, high-SNR sequences for dynamic imaging using
TurboFLASH,TrueFISP or GRE EPI for the detection of
significant coronary artery disease.
Tissue characterization with syngo BEAT: Highly
robust and reproducible late enhancement imaging with IR
(inversion recovery) and PSIR (phase-sensitive inversion
recovery) technique for myocardial tissue characterization,
e.g. after myocardial infarction or for differentiation of
cardiomyopathies.
Coronary imaging with syngo BEAT: Dedicated 2D and 3D
sequences for high-resolution coronary artery imaging,
providing free-breathing and breath-hold techniques.
Vessel wall imaging: High-resolution sequences and
protocols for vessel wall imaging (e.g. atherosclerotic
plaque characterization) in small or large vessels.
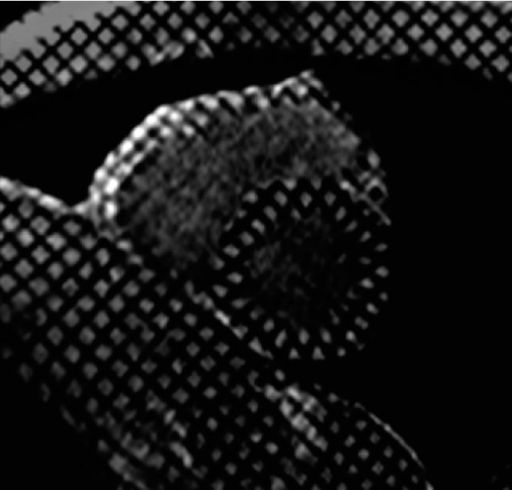 |
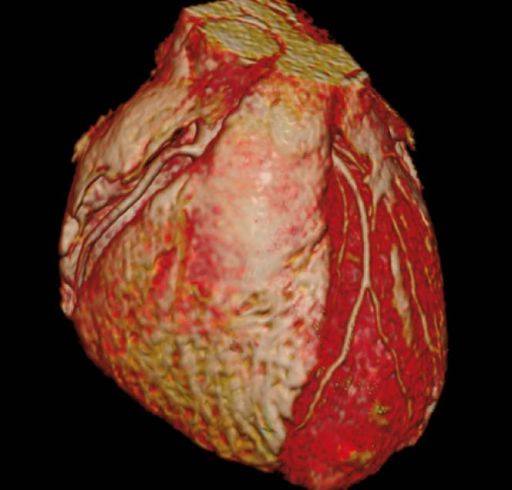 |
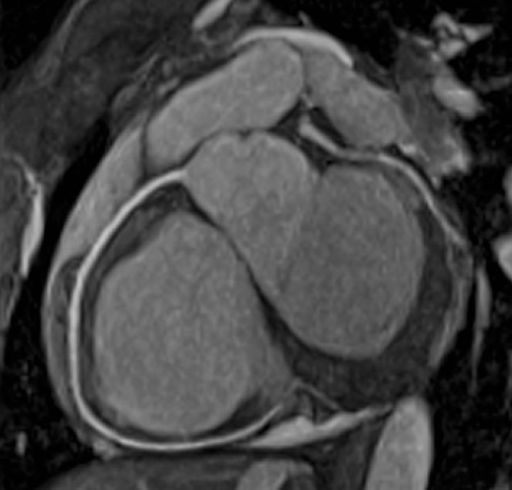 |
|
Grid tagging for visualization of
heart kinetics |
Coronary imaging with syngo BEAT |
Visualization of the right
coronary artery with syngo BEAT |
Step by step:
1. The Advanced Cardiac package or 3D Beat enables 3D
cardiac imaging.
2. Within the function category, this TRUEFISP 3d cine
sequence is prepared.
3. Under tissue characterization, there are3D IR flash and
TRUEFISP sequences available.
4. Coronary imaging is the largest contributor to this
package, as there are TRUEFISP breath hold and free
breathing navigator sequences accessible.
3D Syngo BEAT: This package contains
special sequences and protocols for advanced cardiac imaging
including 3D and 4D syngo BEAT functionalities. It supports
advanced techniques for ventricular function imaging,
dynamic imaging, tissue characterization, coronary imaging,
and more. syngo BEAT is a unique tool for fast and easy
cardiovascular MR imaging. It provides 1-click switch from
cine imaging to tagging for wall motion evaluation and
1-click switch from 2D to 3D imaging. syngo BEAT
automatically adjusts all parameters associated with the
changes.
Cardiac and vessel morphology
• Multi echo technique thalassemia assessment
• 3D aortopathy imaging with free breathing (SPACE)
Morphology and global or regional ventricular wall motion
analysis with syngo BEAT
• 3D cine acquisition for full CT-like heart coverage
• 2D segmented FLASH for visualization of the regional wall
motion using various tagging techniques (grid or stripes)
Dynamic myocardial imaging with syngo BEAT
• Ultra-fast, high-SNR sequence for dynamic imaging with GRE
EPI contrast for stress and rest exams
Tissue characterization with syngo BEAT
• Robust myocardial tissue characterization with 3D PSIR
(phase sensitive inversion recovery), e.g. after myocardial
infarction or for differentiation of cardiomyopathies.
• Fast and complete coverage of the myocardium with IR 3D
FLASH and TrueFISP
Coronary imaging with syngo BEAT
• 3D whole heart non-contrast coronary MRA
• 3D whole heart MRA with advanced free-breathing navigator
compensating diaphragm shifts during the acquisition
(motion-adaptive respiratory gating)
- Argus Viewer on syngo Acquisition Workplace: Viewing software for cardiac MR studies and large data sets.
Efficient CINE review of cardiac and other dynamic data sets
Flexible multi-level sorting
Single movie as well as 2, 4, or 8 simultaneous slices
together in movie mode
Rapid AVI creation of 1 or 4 simultaneous slices
Creates and edits reports
| |
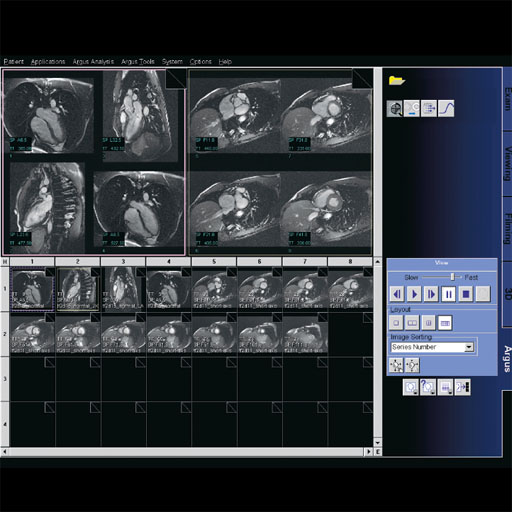 |
| |
Argus Viewer on syngo Acquisition Workplace |
- Argus Viewer:
Viewing Software for Cardiac MR Studies and large data sets.
The Argus Viewer allows users to load a large list of
dynamic data sets and view it comfortably.
For example cardiac images from a patient are loaded and
then automatically sorted into user definable reading
configurations. Resorting and re-display can be changed
instantaneously according to the wishes of the user, either
automatically or manually.
For example:
Grouping based on series description
Grouping based on slice position
Free grouping of image stacks by drag&drop in the image
overview
Additionally, integrated 8 on1 movie provides efficient
review of data
AVI creation of movie loops (up to 4on1) possible.
Main Benefits
Up to 8 series simultaneously in a synchronized movie
displayed
Rapid multi-level sorting
For conferences, presentations and consultation over the
internet
Fast AVI creation
|
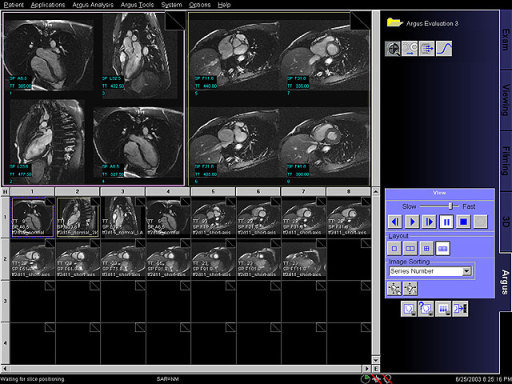 |
|
|
Detailed visualization of all
relevant cardiac images on one page with Argus
Viewer |
|
- AutoAlign: Automated alignment of slice positioning for
head examinations. This option enables easy and accurate
patient follow-up. AutoAlign references the 3D MR brain
atlas and automatically aligns the slice positions in a
standard reproducible way.
| |
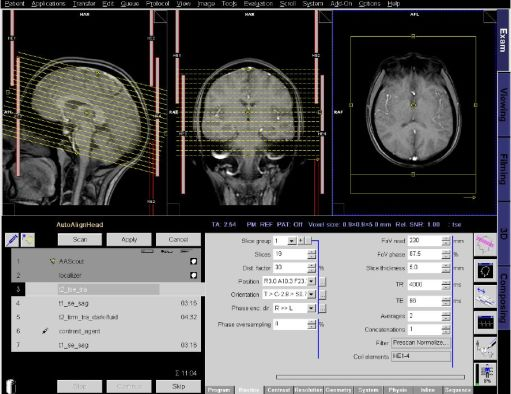 |
| |
Automated positioning and alignment of the
anatomy-related slices using anatomical landmarks. |
- AutoAlign Head LS: Landmark Survey. Needed for
intraoperative MRI. ATLAS included. Angled with AC-PC line.
Automated positioning and alignment of the anatomy-related
sagittal, coronal and axial slices using anatomical
landmarks. Independent of patient age, head position,
disease or user independent positioning standards, the
system automatically finds the correct position.
Features
•AutoAlign Head LS is independent of the coil setup or the
sequence
•AutoAlign assists the user in positioning slices with high
cross-patient robustness
•Provides excellent intra-patient reproducibility
Clinical Applications
Standardized and reproducible patient scanning allows more
accurate diagnosis especially in follow-up patients.
| |
|
| |
Automated positioning and alignment of the
anatomy-related slices using anatomical landmarks. |
Step by step:
1. Auto Align Head: Landmark Survey
2. Load AA Head study into the measurement queue. The
AutoAlign scout will run automatically. This scan is a 3D
series, which produces 2 series. 1 with the "Head Basis"
boney landmark matrix. And one with the "Head Brain" matrix
angled with the AC-PC Line.
3. To ensure proper alignment, open the "Auto Align
Information Dialog".
4. Based on positioning preferences, choose one of the AA
matrixes from the Auto Align dialog.
5. After verifying your positioning, apply the scan.
AutoAlign Head ATLAS:
1. Select Patient/Register
2. On the registration menu select the Search icon.
3. Select the Auto Align patient from the Patient Search
menu and select OK.
4. Continue with the registration, entering the Study and
Patient Position.
5. Select the Exam button and Confirm the registration.
6. An information window will appear to inform the user that
this registered patient is for planning only! Measurements
are not possible. Select OK to acknowledge.
7. Images from the auto align planning patient will appear
in the GSP segments.
8. Open the Exam Explorer by selecting the icon on the Exam
card.
9. Select the AA Scout from the Siemens protocol tree under
Head/AA/Standard_1 and drag it to the measurement queue.
Close the Exam Explorer.
10. Select the remaining protocols you will use for the
study and send them to the measurement queue.
11. Open the localizer sequence and adjust the slices if
needed. Apply the sequence.
12. Open each sequence, position the slices on the AA
planning images and apply each one after positioning.
Continue until all sequences have been positioned and
applied. Now the sequences can be saved for future use.
13. To save, right mouse click in the black area under the
sequences in the measurement queue, Select Save as Program.
14. Assign a name for the Region, Exam, and Programs.
15. Select the SAVE and EDIT button. Select Yes if you are
replacing an existing program.
- AutoAlign Knee: Automated positioning and
alignment of the anatomy related sagittal, coronal and axial
slices using anatomical landmarks. This provides a fast,
easy, standardized and reproducible patient scan and
supports reading, by delivering a higher and more
standardized image quality.
| |
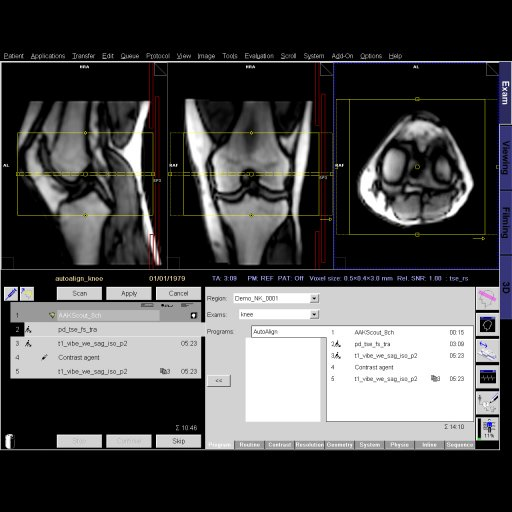 |
| |
AutoAlign Knee software application |
Step by step:
1. Load AA scout and knee protocols into the measurement
queue.
2. Open the AA scout and apply the scan. Ensure that
AutoAlign Knee is selected.
3. Ensure remaining scans have AutoAlign Knee selected on
the Routine Card.
4. Open remaining sequences and adjust coverage if
necessary, and apply the scans. The AutoAlign feature
automatically positions the slice group to the adjusted
condyle landmarks.
5. Review the resulting images.
- AutoAlign Spine: Single mouse click double oblique
positioning of transverse slice packages in spine imaging.
AutoAlign Spine localizes the intervertebral disk on
sagittal images and positions the transverse slice packages
parallel to the disk in a standardized way. This allows for
a faster and easier exam and supports reading by delivering
a higher and more standardized image quality.
Step by step:
1. Automatic Positioning of transversal slices.
2. Move axial sequence into Program control area.
3. Switch AutoAlign on. To do this select Main Menu > Tools
> AutoAlign Spine or open the protocol properties dialog
window and select Properties > Auto Load > AutoAlign Spine.
4. Open the protocol and select the slice group.
5. Press and hold the left mouse button and drag the axial
slice group to any position within an intervertebral disk
6. Release the left mouse button and slice group is
automatically positioned.
7. To manually position a slice group, hold the Shift key
down while moving the slice group
- BOLD Imaging: BOLD (Blood Oxygenation Level Dependent)
Imaging
BOLD Imaging is a technique for non-invasive detection of
functional neuronal activities. MR BOLD Imaging is available
for non-invasive detection of regions of human brain where
functional activities take place: high temporal and spatial
resolution, anatomical and functional images may be
displayed in the same manner.
- Breast Biopsy: Easy to use syngo based post-processing
software helps finding the coordinates for needle insertion
for biopsy or localization of breast lesions detected by MR.
Allows calculation of the coordinates after clicking the
center of the lesion and the Zero marker of the breast
biopsy device.
- BreVis Biopsy: With Sentinelle Vanguard and related accessories.
Accuracy, speed, and efficiency are essential when it comes
to interpreting soft tissue examinations as well as
performing biopsies. Siemens syngo® workplaces (e.g.
MultiModality WorkPlace) are equipped with a great number of
computer-aided tools such as syngo BreVis for real-time
analysis and syngo BreVis Biopsy for interventional
procedure planning.
syngo BreVis Biopsy is a professional solution for a fast
and accurate MR biopsy workflow with automatic calculation
of target coordinates. The user interface offers a guide for
MR interventional planning and supports breast biopsies,
i.e. Sentinelle Vanguard and related accessories. The
easy-to-handle workflow enables shorter examination times
for both patient and operator.
- CARE Bolus: (Combined Applications to Reduce Exposure)
Online-visualization of contrast enhancement for exact
timing of ceMRA.
CARE Bolus protocols and program
Switching from 2D to 3D MRA on-the-fly
Stop and Continue in Exam Taskcard
Centric, elliptical phase reordering
- CISS & DESS: Constructive interference in Steady State
and Double Echo Steady State.
3D DESS (Double Echo Steady State)
T2/T1-weighted
High resolution cartilage imaging
3D CISS (Constructive Interference in Steady State)
Excellent visualization of fine structures such as cranial
nerves
High resolution imaging of inner ear and spine
Step by step:
CISS
1. Finding the CISS sequence in the Exam Explorer; go to
Head, Library and 3D
2. Viewing CISS images in the 3D Task Card
DESS
1. Finding DESS sequences in the Exam Explorer; go to knee,
cartilage
2. Viewing DESS images in the 3D Task Card
- Echo Planar Imaging: EPI sequences including:
Single-shot and segmented 2D/3D SE-EPI, Maxwell term
corrected IR-EPI and FID-EPI for diffusion imaging,
perfusion imaging and ultra fast T2* weighted 2D and 3D
anatomical imaging.
Diffusion Imaging
Single-Shot diffusion- weighted EPI with max. b-value of 10
000 s/mm²
Trace-weighted imaging with 3-scan technique for highest
image quality
Protocols for agitated patients providing artifact minimized
trace weighted images
Dark Fluid IR diffusion measurement for suppression of CSF
signal
Inline Technology: automatic real-time calculation of
trace-weighted images and ADC maps
Multi-directional Diffusion-Weighted Imaging (DWI) with
multiple diffusion directions and b-values: suitable for
investigation of anisotropic diffusion in tissue such as
calculation of diffusion tensors
Perfusion Imaging
Single-Shot EPI for Perfusion
Inline Technology: automatic real-time calculation of Global
Bolus Plot (GBP), Percentage of Baseline at Peak map (PBP)
and Time-to-Peak map (TTP)
| |
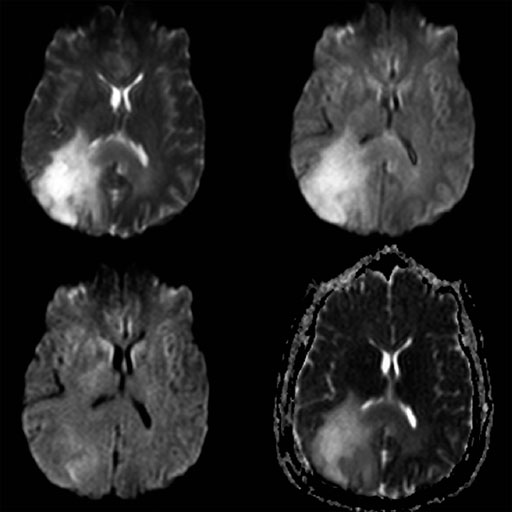 |
| |
Echo Planar Imaging |
- Flow Quantification: Special sequences (only AWP) for
quantitative flow determination studies, measuring blood/CSF
flow non-invasively. Requires Patient monitoring unit (PMU)
option. Retrogated Flow Dynamic representation of temporally
changing flow.
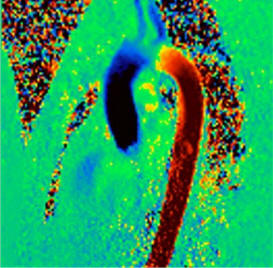 |
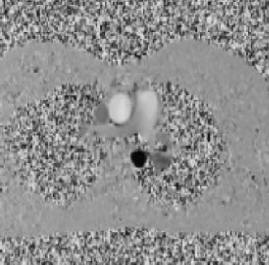 |
| Color-coded sagittal phase images
of the thoracic aorta |
Phase image of the aortic arch
and major pulmonary vessels. |
Step by step:
1. Run localizer scans. Ensure all scans are set to "iso"
mode, so the area of interest will be located in isocenter.
2. For in-plane flow imaging, position the slices parallel
to the flow. For thru plane imaging, position the slices
perpendicular to the flow.
3. Set 1st signal mode for triggering, always using "Retro
gating". If pulse triggering use Pulse/Retro, if ecg
triggering use ECG/Retro.
4. Apply the scan.
5. Load the phase image into the UI.
6. Right click the phase image and select Movie On to
visualize the flow.
- Fly Through: Simulated endoscopic views of the
bronchi, vessels, colon and other hollow structures.
Multi-modality application for CT, MR and 3D AX data.
Fully integrated into the familiar syngo 3D workflow and
user interface.
Step by step:
1. Load a MRA sequence into 3D MPR. Select the MRA sequence,
go to applications and select MPR.
2. Change segments 1 and 2 images into MIP views. Select the
1st segment, the outline will turn bold, and select the MIP
icon, repeat for the 2 segment.
3. Create the endoscopic view. Select the 3rd segment, and
then left click the Fly Through icon.
4. Set the window for the endoscopic view. Right click the
SSD icon and change the High Value to remove the pink
coloring from the inside of the vessels. In this case it was
50.
5. Right click within the endoscopic view to activate
navigation tools. Auto navigation will allow holding the
left key of the mouse and sliding it forward to move forward
thru the aorta.
6. Rotating around a viewing point, within the navigation
tool, allows viewing left-right, or top-bottom.
- GRACE: GeneRAlized breast speCtroscopy Exam- Choline
level follow up to evaluate Ca breast: (GeneRAlized breast
speCtroscopy Exam)
SVS technique (spin echo sequence) optimized for breast
spectroscopy.
The technique contains a special spectral lipid suppression
pulse (user definable) for lipid signal reduction. Siemens
unique water reference detection to visualize the normalized
choline ratio.
Online frequency shift correction for reduction of breathing
related artifacts, Inline implementation – no additional
user interaction is required.
Clinical applications:
• Differentiating benign from malignant breast lesions
• Predicting clinical response to neoadjuvant chemotherapy
in an early stage (24hours after receiving the first dose)
| |
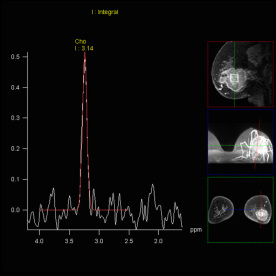 |
| |
Increased Choline-signal within breast tumor,
shown with syngo GRACE |
- Inline Composing: Composed images can be automatically
loaded into graphical slice positioning for planning
purposes. Automatic anatomical or angiographic composing of
multiple adjacent coronal or sagittal images for
presentation and further evaluation.
| |
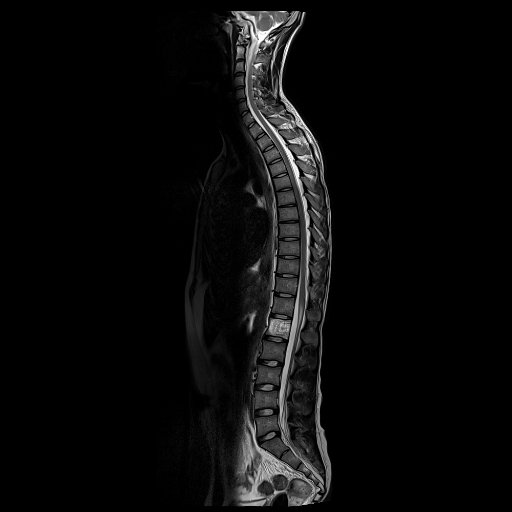 |
| |
Inline Composing |
Step by step:
1. To find sequences with Inline Composing set up, open the
Exam Explorer and locate regions where Inline Composing is
utilized.
2. Open a sequence.
3. It the system has the Tim Planning Suite, Inline
Composing can be found in the Geometry parameter card.
4. The first Inline Composing parameter is the checkbox for
Inline Composing. This invokes the Inline Composing
function.
5. The Composing Function controls the algorithm that will
be used to reconstruct the images.
6. Composing Group identifies all steps that will be
composed.
7. The last step function identifies the sequence that is
the last step of a multi-station examination; e.g., the
lumbar spine measurement in a whole spine protocol.
8. If the system does not have Tim Planning Suite, the same
information can be found in the Inline parameter card, in
the Composing tab.
- Inline Diffusion: Automatic creation of Trace weighted
and ADC diffusion maps.
Automatic real-time calculation of trace-weighted images and
ADC maps with Inline Technology. Compatible with single-shot
diffusion weighted EPI.
Inline Diffusion enables syngo REVEAL body diffusion
applications.
Clinical Applications
Stroke imaging
Tumor differentiation in head and body applications
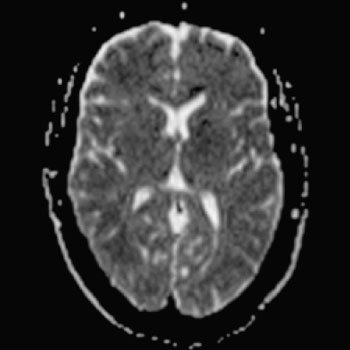 |
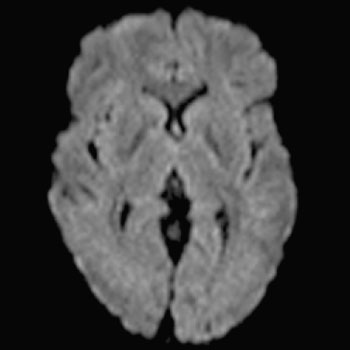 |
| Automatic real-time calculation
of trace-weighted images and ADC maps |
Automatic real-time calculation
of trace-weighted images and ADC maps |
Step by step:
1. Add the epi2d_diff_3scan_trace sequence to the
measurement queue. It is located in the exam explorer,
advanced applications library, then diffusion and perfusion.
Right click the sequence and select Append to Queue.
2. Open the sequence and position.
3. The inline functions are located on the Diff sub task
card of the sequence.
4. Ensure that the Trace and Average ADC maps are selected
and apply the scan.
5. With inline Diffusion there are 4 images produced per
slice position.
6. Without this option, using orthogonal diffusion, there
are 10 images per slice position. There are also no Trace
images available.
- Inline Perfusion: Automatic real-time calculation
of Global Bolus Plot (GBP), Percentage of Baseline at Peak
map (PBP) and Time-to-Peak map (TTP) with Inline technology. Creating color perfusion maps of the
brain.
| |
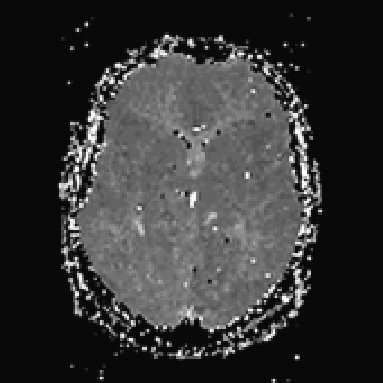 |
| |
Automatic real-time calculation of perfusion
parameters |
Step by step:
1. First, locate and open a perfusion sequence in the Exam
Explorer.
2. Go to the Perfusion parameter card.
3. GPB (Global Bolus Plot): This parameter determines
whether a global time-density curve has been determined for
evaluating the bolus passage.
4. PBP (Percentage of Baseline at Peak Map): This parameter
determines whether a percental signal image should be
reconstructed for every slice. This image shows the signal
change of the bolus peak relative to the base line. The
brighter an image area, the less contrast agent arrived
onsite.
5. TTP (Time-to-Peak-Map): This parameter determines whether
a time-to-peak image is reconstructed for every slice. The
pixel intensity value in the image shows the time that
expired until the signal peak was reached. The brighter an
area in the grayscale image, the more time expired until the
signal peak was reached.
- Soft Tissue Motion Correction:
3D elastic motion correction, for offline 3D correction in
all directions over entire 2D and 3D data sets suitable for
e.g. soft tissue MR exams. Allows higher conspicuity and
accuracy especially for multi-focal lesion detection. New
image data is reconstructed and saved in a separate series
within the patient browser. It can be combined with the
original non-corrected image data.
| |
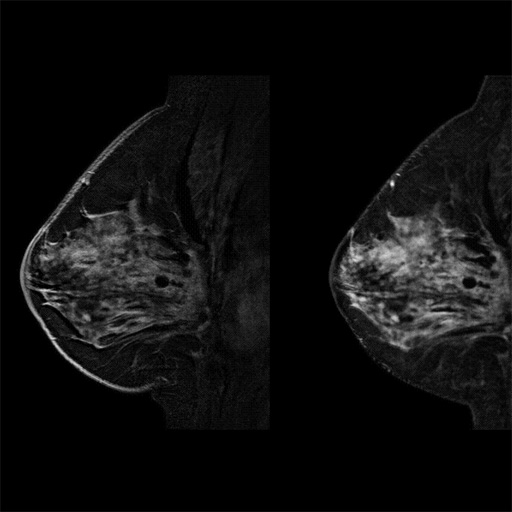 |
| |
Clear reduction of artifacts by the soft tissue
motion correction |
- MR Elastography: For liver fibrosis needs hardware and
software. Anew MRI-based biomarker for characterizing tissue
non-invasively is provided. Furthermore this represents a
new approach of improved treatment decisions, especially in
the field of liver fibrosis. The MR Elastography package
includes hardware and software.
Clinical Applications
New approach for improved decisions, especially in liver
fibrosis
Non-invasive assessment of variations in tissue stiffness
Features
iPAT enables shortened breath-hold time
Fully integrated processing of the elastogram at the scanner
Completely automated calculation of wave images and
corresponding elastograms
Statistical confidence map for reliability
Hardware and software*
Resoundant® active and passive drivers
Sequence and protocols with 2D gradient-echo sequences with
cyclic motion-encoding gradients (MEG)
- 31 P Spectroscopy: Optimized for liver and heart
applications.
Integrated package with RF coil, sequences and protocols for
31P spectroscopy.
Offering the same level of user friendliness and automation
as 1H spectroscopy.
1H/31P transmit/ receive Heart Liver coil for 31P
spectroscopy
Short TE CSI sequence and protocols optimized for heart and
liver applications
NOE (Nuclear Overhauser Effect) and 1H decoupling available
ECG triggering available
Weighted acquisition available
- Advanced 3D Imaging Package: 3D DESS and 3D CISS.
Advanced 3D Applications Package contents of sequences and
protocols which are unique to Siemens.
3D DESS for high-resolution 3D studies of joints with
excellent T1 and T2 contrast. DESS is a double echo gradient
sequence in which a FISP (transversally rephased gradient
echo) and a PSIF (RF-refocused gradient echo) echo are
simultaneously acquired and added, resulting in an increased
signal-to-noise ratio.
3D CISS for excellent very high resolution studies,
especially useful in inner-ear examinations.
These Advanced 3D data sets provide very thin contiguous
slices with high signal-to-noise ratio which are also well
suited to MPR post-processing along straight (oblique or
double oblique) or curved lines. In some cases such as MR
Myelography or inner ear work, the MIP algorithm also
provides very useful information.
| |
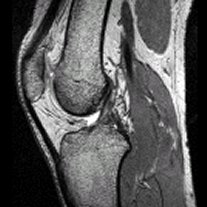 |
| |
3D DESS sequence with T1/T2 |
- Advanced Angio: Sequences and protocols optimized for
the head/neck, body and peripheral region.
Turbo contrast-enhanced MRA technique for up to 50% faster
studies than conventional MRA
2D Time-of-Flight (ToF) triggered and segmented
2D/3D Phase Contrast (PC) Angiography with multi velocity
encoding
3D VIBE. Breath-hold examination based on 3D FLASH using
interpolation and quick fat saturation.
Isotropic voxels allow multiplanar volume imaging of organs
Parenchymal imaging and angiography with a single dose of
contrast agent
Protocols for virtual MR Colonoscopy
- Advanced Diffusion: DWI base on HASTE and REVEAL
Selection of advanced fast imaging techniques optimized for
ultrafast imaging.
Diffusion weighted imaging based on HASTE
REVEAL: diffusion imaging for liver, ortho and spine exams.
Prerequisite for abdominal applications (e.g. liver
diffusion) is the option “PMU Wireless Physio Control“
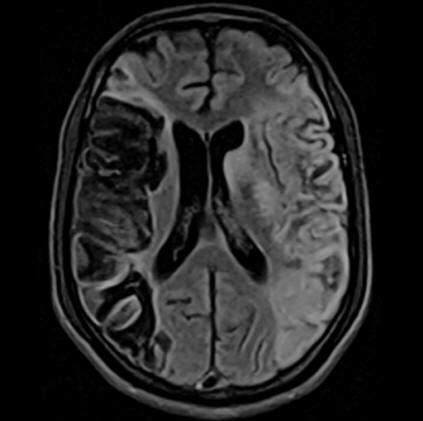 |
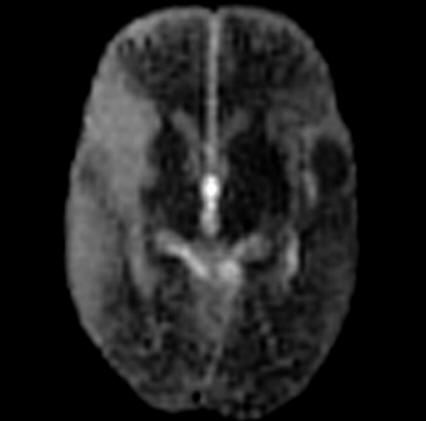 |
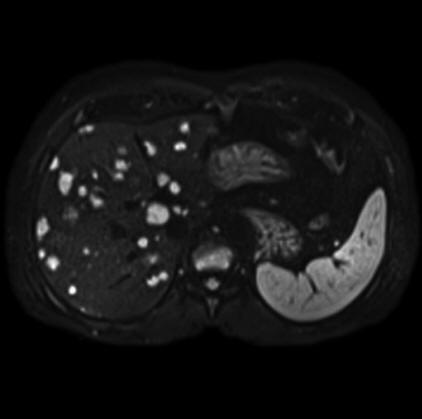 |
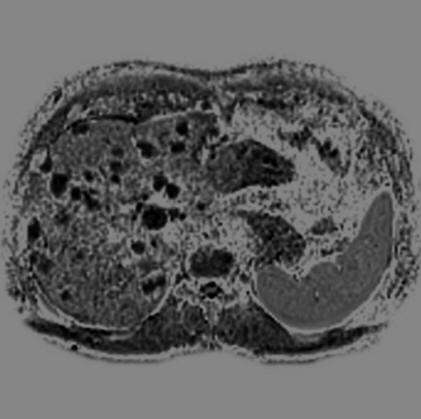 |
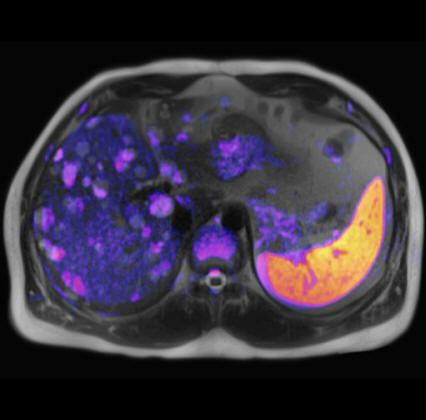 |
| Dark Fluid tra |
Diffusion HASTE tra |
Hyperintense signal on b-value 50
correlates with the low
ADC map showing mts in the liver |
Hypointense signal on ADC map
inverted demonstrating metastases
in the liver |
High-signal intensity
demonstrating metastases in the liver |
- Advanced Turbo: Ultra fast imaging
Selection of advanced fast imaging techniques optimized for
breath-hold and ultrafast imaging.
2D/3D TrueFISP for fast T2 imaging, compatible with FatSat
(protocols for virtual MR Colonoscopy)
2D/3D HASTE (Half-Fourier Acquisition with Single-Shot Turbo
Spin Echo)
2D/3D HASTE IR for fat suppression
2D/3D Single Shot Turbo SE for very heavy T2-weighting
PSIF Diffusion
Segmented 2D/3D EPI (SE and FID)
HASTE and TrueFISP compatible with 2D PACE
Shared phases real-time TrueFISP
- Panoramic Table for Integrated Panoramic Positioning
Automatic and software controlled table positioning for
imaging of large anatomies (spine, chest/abdomen, peripheral
angiography).
Automatic patient table movement
Simultaneous setup of multiple exams
Imaging with body coil, optional surface coils and
CP PAA coil
Includes automatic switch of active coil elements
| |
 |
| |
Panoramic Table for Integrated Panoramic
Positioning (IPP) |
- TGSE: (Turbo Gradient Spin Echo): Ultra-fast sequence
providing high resolution imaging or extremely short
acquisition times
Hybrid Turbo Spin Echo / Gradient Echo used primarily for
T2-weighted imaging
• Shorter measurement time
• Decreased RF power deposition
• Improved visualization of hemorrhage, due to magnetic
susceptibility differences
• High resolution imaging of brain and spine
| |
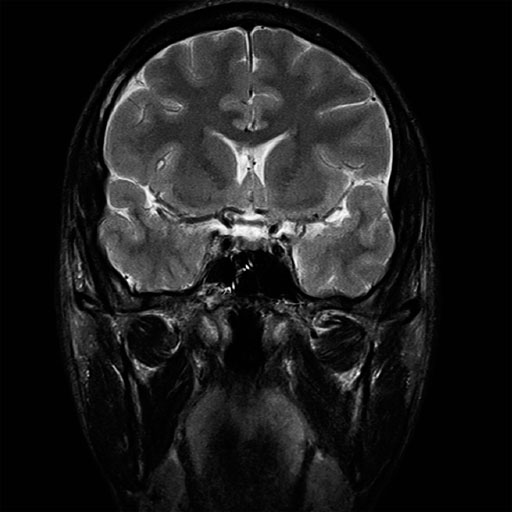 |
| |
TGSE - Turbo Gradient Spin Echo |
- Spine Composing: Seamless composition of images acquired
in multiple stages. (e.g. whole CNS studies)
| |
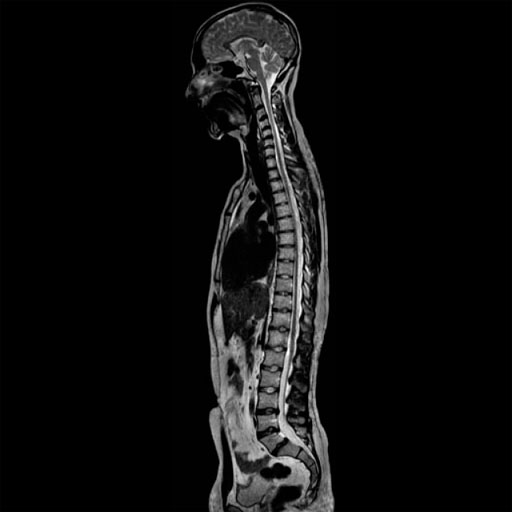 |
| |
Spine Composing |
- Multi-Channel Application Suite:
2D PACE (Prospective Acquisition CorrEction)
LOTA (Long Term Data Averaging) technique for motion and
flow artifact reduction without increasing scan time
Elliptical scanning reduces scan time for 3D imaging
Selectable centric elliptical phase reordering via the user
interface
Inversion Recovery to nullify the signal of fat, fluid or
any other tissue
True Inversion Recovery to obtain strong T1-weighted
contrast
Dark blood inversion recovery technique that nulls fluid
blood signal
Saturation Recovery for 2D TurboFLASH, gradient echo, and
T1-weighted 3D TurboFLASH with short scan time (e.g. MPRAGE)
Presaturation Technique. RF saturation pulses to suppress
flow and motion artifacts. Up to six saturation bands may be
positioned in any orientation
- Multinuclear Option: Hardware and IDEA software package
to investigate 3He, 7Li, 13C, 19F, 23Na, 31P, 129Xe. NOE
(Nuclear Overhauser Effect and 1H decoupling).
Integrated hardware and system software package.
Transmit/ receive experiments can be realized to investigate
3He, 7Li, 13C, 19F, 23Na, 31P, 129Xe
Highly flexible design of imaging and spectroscopy sequences
using the IDEA package NOE (Nuclear Overhauser Effect)
experiments and 1H decoupling can be realized
| |
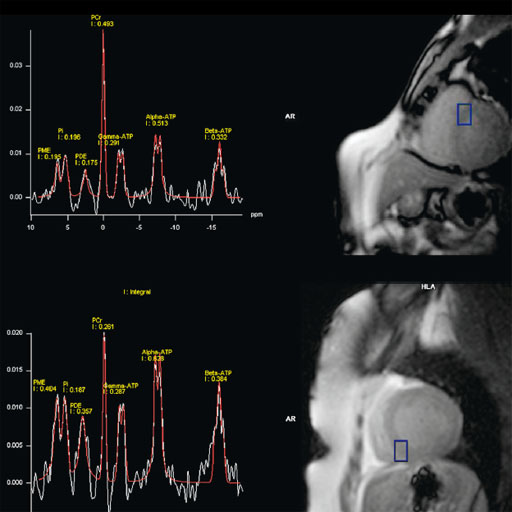 |
| |
Multinuclear Option |
- Interactive Realtime Imaging:
The user can navigate in all planes on-the-fly during data
acquisition.
Real-time cardiac examinations
Real-time interactive slice positioning and slice angulation
3D Magellan SpaceMouse included
Post-Processing Packages:
-
syngo Argus 4D Ventricular Function
syngo Argus 4D VF software processes MR cine images of the
heart and generates quantitative results for physicians in
the diagnostic process.
It provides volumetric cardiac data of a given patient very
quickly and easily. Parametric results and volume-time
curves are being calculated upon automatic creation and
adaptation of a 4D model of the left ventricle. The
resulting 4D model of the patient’s heart can be visualized
superimposed to anatomical images as reference.
syngo Argus 4D VF includes the well-known functionalities of
Argus Function, the automated tool for cardiac function
evaluation.
• Fully automatic left ventricle and semi-automatic right
ventricle segmentation
• Easy user guidance with graphical selection of ED, ES,
basal and apical slices
• Volumetric and regional wall motion analysis (e.g. stroke
volume and bull’s-eye plots)
Features
A 4D model can be created with a few mouse clicks by
defining the center of the LV apex on an apical short-axis
cine, center of the LV base on a basal short-axis cine,
mitral valve insertion points on a 2- and/or 4-chamber plane
in diastole and systole.
The model-based algorithm provides within a few seconds the
appropriate endo- and epicardial contours on all slices and
phases as well as a summary table including various data for
volume, function and mass.
No missing ventricular volume nor additional atrial volume
deterioration due to cardiac phase adaptive 4D model.
Clinical Applications
Highly accurate volumetric assessment and ejection fraction
calculation in cardiomyopathy (dilated, hypertrophic, etc.),
pericardial disease, cardiac tumors and cardiac transplants.
Step by step
1. Load cine cardiac study into Argus 4D Taskcard.
2. Place marker in center of the LV of the most apical slice
position.
3. Place marker in the center of the LV of the most basilar
slice position.
4. Place markers at the insertion points of the mitral valve
on a long axis view, at both end systole and end diastole.
5. Adjust the markers for the position of the right
ventricular insertion points.
6. If necessary, adjust the endo and epicardial contours.
7. View and save the ventricular results
- Argus Flow
Automated tool for analysis of blood and CSF flow.
• Semi-automatic detection of regions of interest over time
• Color-coded display of velocity values
• Calculation of flow and velocity parameters (e.g. peak
velocity, average velocity, flow, integral flow)
Clinical Applications
Evaluation of valvular diseases
Evaluation of hydrocephalus
Carotid stenosis
Pulmonary hypertension
Evaluation of bypass grafts
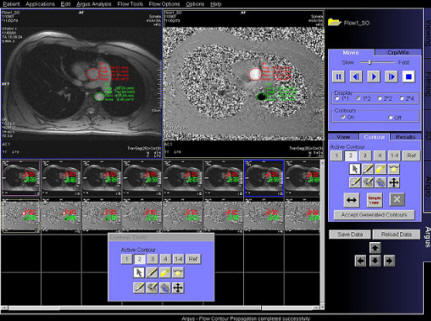 |
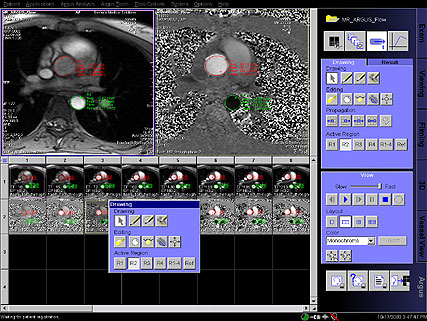 |
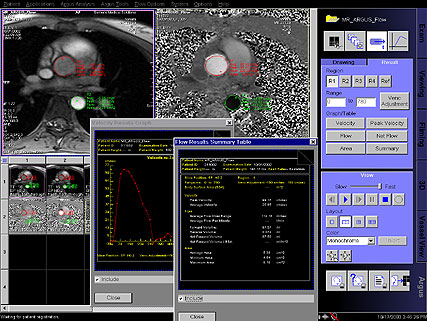 |
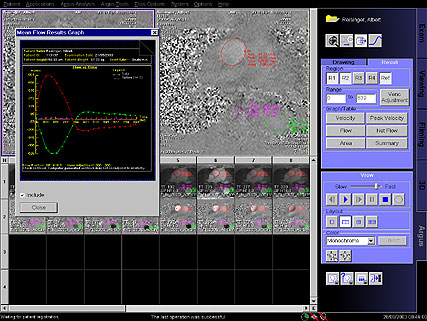 |
| Descending and
ascending aortic flow measurement with Argus Flow |
Step by step
1. From the patient browser, load the Rephased and phase
series into the Argus Viewer. This is done by selecting both
series and left clicking on the "Argus Icon".
2. Use the "zoom-pan" icon to magnify the series to better
visualize the vessel contours. Be sure to select all series
using the icon between the "A" and "1" prior to left
clicking on the outer edges of the image segment and
zooming.
3. Select the "Flow analysis" Icon within Argus, new tools
will appear to begin the post-processing.
4. Select the drawing tool and move the curser over first
region, up to 4 regions can be evaluated. Left click and
drag curser over vessel to cover lumen.
5. The contour drawn will automatically adjust to the vessel
shape.
6. Next choose "Propagate within Slice". This will transfer
the contour you have drawn over all phases and automatically
adjust the contour for vessel contractionexpansion.
7. Repeat these steps for all regions you wish to evaluate.
To draw another region, select the next region button, for
example R2 under the active region tools.
8. To create the results of this analysis, go to the
"Results" tab. Results for Velocity, Peak Velocity, Flow,
Net Flow, Area and a Summary Page can be seen for a region
or all regions a contour has been drawn.
9. Once the result have been generated, select the "save as"
icon to store in the Patient Browser as dicom images.
10. These reports and the contouring are stored as an Argus
file. These can be loaded into the viewing taskcard, or sent
to a PACS station for reporting.
- Argus Dynamic Signal
Automated tool for dynamic data analysis.
• Manual or automatic segmentation
• Automatic compensation of contours in regard to
translation or deformation of organs over time
• Sector-based or ROI-based evaluation
• Evaluation of Time-to-Peak, Peak Value, Uptake Slope, Area
under the Curve
• Graphical display of results in parameterized bull’s eye
plots
- Vessel View
Interactive analysis of vessel disease using MR or CT
angiography data.
Viewing with VRT, MPR, or MIP mode.
• Semi-automatic detection of vessel segments
• Quantification of changes in vessel size (e.g. stenosis
graduation, aneurysm volume measurement)
• Protocol-based software for workflow support
• Creates and edits DICOM structured reports
| |
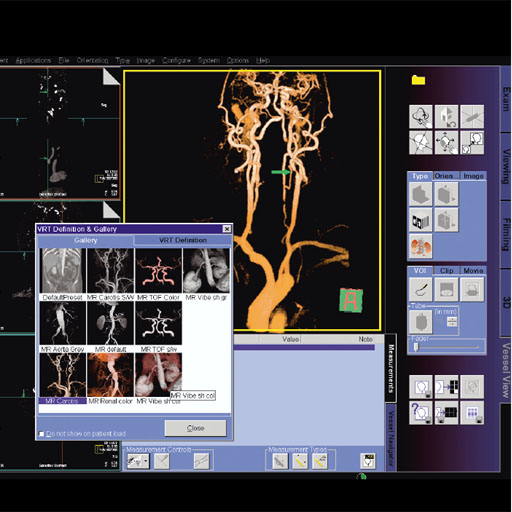 |
| |
Vessel View |
- Vessel View Artery-Vein-Separation
This package allows for semi-automated segmentation and
separation of arteries and veins, as well as suppression of
surrounding tissue. Supports modes allowing the display of
only arteries or only veins, or arteries and veins together
in different colors. (Prerequisite: Vessel View)
- 3D VRT Volume Rendering Technique
3D visualization for clearer depiction of complex anatomy
and relationship of anatomy in 3D for contrast MR
Angiography and VIBE imaging.
More productive surgical planning and discussion with
referring physicians.
• Integrated with other 3D functionality
• Color image creation
• Color gallery of icon presets
• Additional threshold-based segmentation of 3D objects
• Volume measurements
Clinical Applications
MR Angiography
MR Cholangiopancreatography
Step by step:
1. Load 3D series from the Patient Browser into the 3D Task
Card by selecting Applications from the menu, then select
3D>VRT.
2. Change VRT settings by right mouse clicking on the VRT
icon and selecting the appropriate image type from the VRT
Gallery.
3. Change all segments to the same CRT type by selecting
each segment and left mouse clicking on the VRT icon.
4. Left mouse click on the VRT thin icon to change the image
type. To modify the image thickness, right mouse click on
the VRT thin icon and change the thickness in the dialogue
window.
5. Left mouse click on the Radial Ranges icon to create a
series of rotated images.
6. It is important to first select the image you want to set
the rotations off of; e.g., for a left to right rotation,
select the axial (bottom left) image.
7. Save radial ranges as a new series to the Patient Browser
by selecting Patient>Save as. Type the name of the new
series into the “Range series name” text area.
- syngo BOLD 3D Evaluation
Comprehensive processing and visualization package for BOLD
fMRI. It provides a full set of features for clinical fMRI,
as well as advanced features for more research oriented
applications.
This package provides statistical map calculations from BOLD
datasets and enables the visualization of task-related areas
of activation with 2D or 3D anatomical data. This allows the
visualization of the spatial relation of eloquent cortices
with cortical landmarks or brain lesions.
On the syngo Acquisition Workplace the unique Inline
function of BOLD 3D Evaluation merges, in real time, the
results of ongoing BOLD imaging measurements with 3D
anatomical data. Additionally, evolving signal time courses
in task-related areas of activation can be displayed and
monitored.
Functional and anatomical image data can be exported for
surgical planning as DICOM datasets, additionally all color
fused images and results can be stored or printed.
• Statistical map generation: paradigm definition,
calculation of t-value map with General Linear Model or
t-test
• 3D Visualization: fused display of fMRI results, color
t-value maps on anatomical datasets
• Inline 3D real time monitoring of the fMRI acquisition
• On-the-Fly Adjustment for t-value thresholding, 3D
clustering, and opacity control
• Data export to neurosurgical planning software
• Fly Through the Volume: Zoom, pan, rotate, cut planes
• Analysis of Signal Time Curves
• Data Quality Monitoring: B0 field map, cine display of the
BOLD time series
• Archiving & Distribution of results and views as colored
DICOM images and bit maps
• If the respective options are available, results from
Diffusion Tensor Imaging and DTI Tractography can be
displayed together with fMRI results and anatomy
- DTI Evaluation
Offline post-processing to generate and visualize parametric
maps derived from the diffusion tensor in order to assess
anisotropic diffusion properties of brain tissue
• Generation of diffusion maps based on tensor including:
Fractional Anisotropy (FA), Volume Ratio (VR),
trace-weighted, ADC, E1–E3, E1,
linear, planar, tensor maps
• Display of maps in scalar mode (grey scale), vectorized
mode (directions color coded) and tensorized mode (using
tensor graphics like ellipsoid or cuboids); overlay of maps onto anatomical
images
• Side by side display of several maps (e.g. ADC, FA, and
trace-weighted) and anatomy for simultaneous ROI based
evaluation; generation of a results table in order to
support the assessment of diseases of the white matter
• Integrated into Neuro 3D task card: display of DTI maps in
the context of an anatomical 3D data set; arbitrary oriented
clip planes allow to explore the 3D volume
• Fused display with white matter tracts if the “DTI
Tractography” option is present.
• Export of reformatted images for neuronavigation
• Together with the “BOLD 3D Evaluation” option:
simultaneous display of anatomical, fMRI, and DTI data
| |
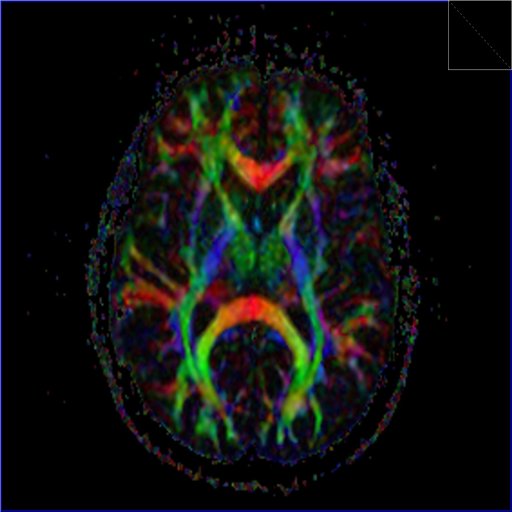 |
| |
FA map generated with syngo DTI and inline
function |
Step by step:
1. From the patient browser, load the Tensor series into
Neuro3D application.
2. The data automatically loads into the diffusions mode.
With the first segment showing a FA map, the second an ADC
map, the third a Trace weighted map and the fourth a B0
3. Select the Diffusion subtask card to change selected
segment to a new map.
4. Scroll thru the images by using any of the "dog ears".
5. Additional maps can be found under the diffusion drop
down menu.
6. To save any of these maps; select segment of map, go to
Patient, and select "save Diffusion"
7. These maps can be loaded in the Viewing Task card or sent
via PACs.
- syngo DTI Tractography
syngo DTI Tractography allows the visualization of multiple
white matter tracts based on diffusion tensor imaging data.
DTI Tractography is optimized to support the presurgical
planning and to allow for neuro physiological research with
respect to connectivity and white matter pathology.
• Advanced 3D visualization of white matter tracts in the
context of 2D or 3D anatomical and DTI datasets
• Texture Diffusion, a highly versatile in-plane
visualization of white matter tracts, allows to display and
read DTI Tractography results on PACS reading stations and
in the OR
• Seed points for tracking with single ROI and with multiple
ROIs to assess connectivity
• Tract and seeding ROI statistics (mean / max FA value, min
/ mean / max ADC value, and more)
• DICOM export of views, HTML export of Tract, and seeding
ROI statistics
• Interactive QuickTracking displays the tract originating
from the mouse pointer position while moving over the DTI
data set
- Neuro Perfusion Evaluation
Dedicated task card for quantitative processing of neuro
perfusion data.
• Color display of relative Mean Transit Time (relMTT),
relative Cerebral Blood Volume (relCBV), and relative
Cerebral Blood Flow (relCBF)
• Flexible selection of Arterial Input Function (AIF) for
reliable analysis. This function takes into account the
dynamics over time of the contrast agent enhancement
Step by step:
1. Load the ep2d_perf images into the MR Perfusion task card
via the applications dropdown in the patient browser menu.
2. Locate an artery and select AIF input.
3. Move the arterial input function box over the selected
artery, and choose the optimal curve. This curve should have
the flattest baseline and deepest curve.
4. Proceed to setting the time ranges. Place the time points
for 1. Start of enhancement and 2. end of enhancement
5. Confirm Time Ranges
6. Select color maps to generate. Choose all maps to
generate all selections.
7. Select the "Execute" Icon Four series of color maps will
be displayed. In the 3rd are the relMTT and TTP maps. In the
4th segment are the relCBV and relCVF maps.
Window and save series. Each series must be windowed and
saved separately. They can then be reviewed in the Viewing
task card or sent to PACs.
- Composing
Composing of images from different table positions.
• Automatic and manual composing of sagittal and coronal
images
• Dedicated algorithms for spine, angiography, and adaptive
composing algorithms
• Measurement on composed images (angle, distance)
- Fly Through
Simulated endoscopic views of the inside of bronchi,
vessels, colon, and any other hollow structures.
Multi-modality application for CT, MR, and 3D AX data.
Fully integrated into the familiar 3D workflow and user
interface.
• Ready-to-use from day one
• One click to action
- syngo Tissue 4D
syngo Tissue 4D facilitates the detection of tumor tissues
in organs such as the prostate or the liver.
It is an application card for visualizing and
post-processing dynamic contrast-enhanced 3D datasets.
Evaluation options
• Standard curve evaluation
• Curve evaluation according to a pharmacokinetic model
Visualization features 4D visualization (3D and over time)
Color display of parametric maps describing the contrast
media kinetics
such as:
• Transfer constant (Ktrans)
• Reflux constant (Kep)
• Extra vascular extra cellular volume fraction (Ve)
• Plasma volume fraction (Vp)
• Initial Area-Under-Curve (iAUC) for the first 60 seconds
Additional visualization of 2D or 3D morphological dataset
Post-processing features Elastic 3D motion correction
Fully automatic calculation of subtracted images
Pharmacokinetic model Pharmacokinetic calculation on a
pixel-by-pixel basis using a 2-compartment model.
Calculation is based on the Tofts model. Various model
functions are available.
Manual segmentation and calculation on the resulting images.
The following resulting images can be saved as DICOM images:
• 3D motion-corrected, dynamic images
• Colored images
• Storage of calculated results
• Export of results in the relevant layout format
| |
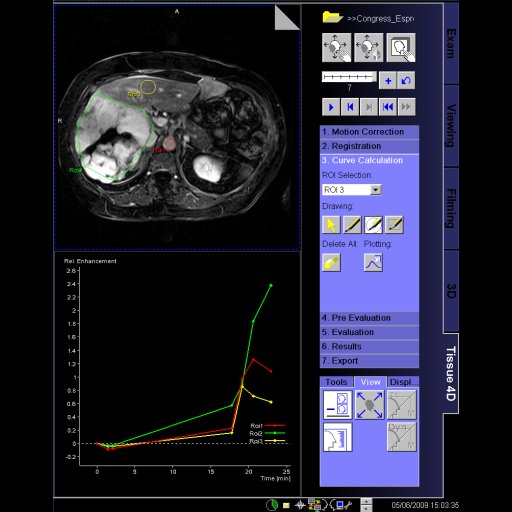 |
| |
Evaluation of dynamic liver MR examination with
syngo Tissue 4D |
Step by step:
1. Open the patient browser and load program data sets into
the Tissue4D Task-card. Use the Tissue4D icon after
selecting the patient.
2. Select the Registration tab, step 2. Select the
Registration Icon. This will automatically align the dynamic
data sets to the pre-contrast data set.
3. Select Curve Calculation, Step 3. Select Drawing to and
create ROI1 over area of interest. Up to 4 ROI's can be
drawn.Select Start Ploting
4. Continue to Pre Evaluation, step 4. Here we select the
contrast agent used,and draw the VOI to cover the entire
anatomy of interest. Draw the VOI. To do this left click and
drag the curser.
5. Select Evaluation, step 5. Select the AIF modeling.
Change selection of evaluation to VOI, and start evaluation.
6. Select the Results tab to generate final results, Step 6.
Calculate and show statistics. Maps and results are created
for each ROI. Resulting statistics are: kTrans, Kep, Ve and
iADC.
7. The results can be exported, step 7.
- Spectroscopy Evaluation
Integrated software package with extensive graphical display
functionality
Comprehensive and user-friendly evaluation of spectroscopy
data
Display of CSI data as colored metabolite images or spectral
overview maps, overlaid on anatomical images
• Export of spectroscopy data to a user-accessible file
format
• Relative quantification of spectra, compilation of the
data to result table
Automated peak normalization tissue, water or reference
New dedicated Single Voxel Spectroscopy breast evaluation
protocols
- Image Fusion
Image fusion of multiple 3D data sets with alpha blending,
i.e. overlay of two images with manual setting of the
opacity
• Multiple 3D data sets from different modalities (MR, CT,
Nuclear Medicine, PET)
• Visual alignment, automatic registration, or landmark
based registration
Image Fusion provides a dedicated evaluation software for
spatial alignment (matching) and visualization of image data
either from different modalities (CT, MR, NM, PET) or from
the same modality but from multiple examinations of the same
patient. It supports optimal diagnostic outcome (fusion of
morphological and functional information) and therapy
planning. CT, MR, NM or PET images are accepted as input for
image fusion.
Clinical Applications
Combination of functional information and excellent
anatomical data to improve diagnostic accuracy. Eg: syngo
MapIt results combined with MR joint images.
Features
Dual modality applications like MR&PET or CT&MR by combining
the 3D data sets with alpha blending
Combination of functional and morphological information
Up to 4 data sets can be fused.
Additional Information
Registration Algorithms: Easy-to-use visual alignment with 6
degrees of freedom (3x translation, 3x rotation).
Landmark-based registration with convenient landmark edit
for point-based registration using anatomical landmarks.
Automatic registration. Storage of transformation matrix
after registration for later retrieval with data sets.
Visualization Techniques: side-by-side visualization of both
data sets with correlated pointer and correlated scrolling
with dog ears. 2D alpha-blending in monochrome or
pseudo-color with adjustable balance between the two
superimposed data sets. Storage of fused results as
secondary capture images.
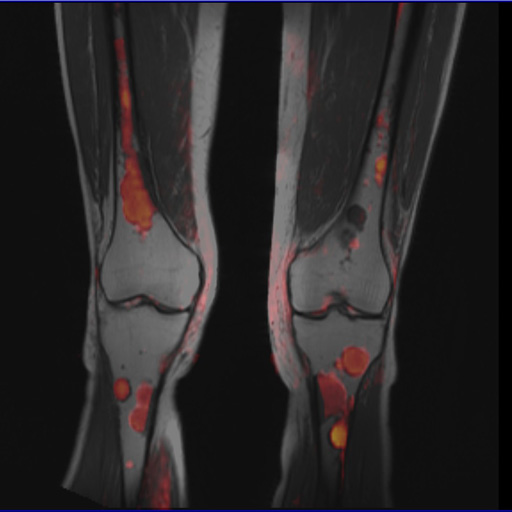 |
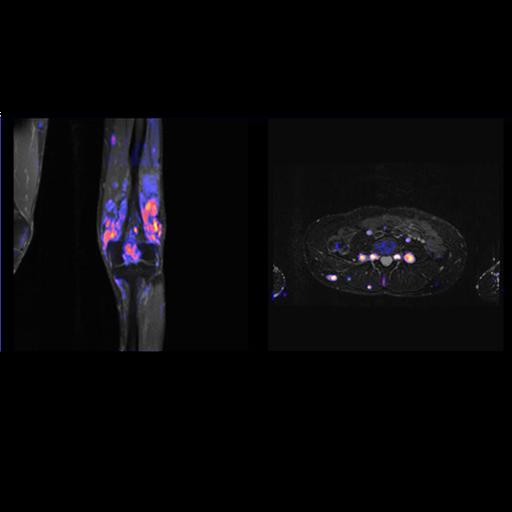 |
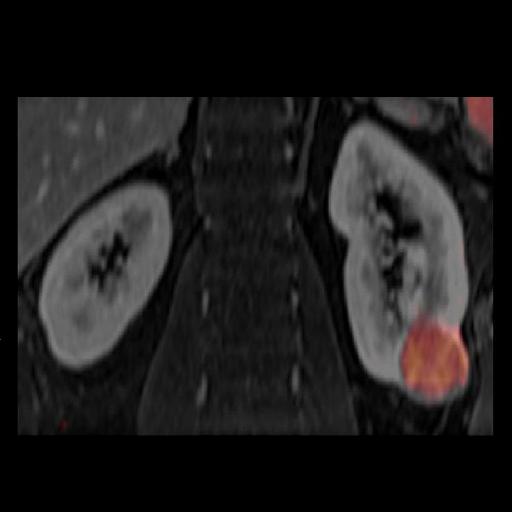 |
| High b-value DWI for visualization of tumor
activity fused with T1w morphology |
Improved visualization of multiple neurofibroma
with DWI. superimposed on T2w images |
Fused image (Reveal (Diffusion weighted)+ T1
fat-sat) showing a kidney tumor |
Step by step:
1. Aligning and superimposing multimodality images
2. Open Patient Browser; select the first modality series
and load into MPR within the 3D Task-card.
3. Re-open the Patient Browser, select the second modality
series.
4. Left click on the Fusion icon; this will add the second
modality into the 3D Task-card.
5. Go to the Image sub-task card, and left click on the
Registration icon.
6. The Fusion Registration page will appear, left click on
the Auto Icon and choose "Precise Registration". Then
register, and okay. Choose save registration when this
pop-up appears.
7. Left click the Side x Side tool to evaluate the 2
modality series in parallel.
- syngo Breast Biopsy Software
Easy to use syngo-based post-processing software helps
finding the coordinates for needle insertion for biopsy or
localization of breast
lesions detected by MR
Allows calculation of the coordinates after clicking the
center of the lesion and the 0 marker of the breast biopsy
device
• Printout of working sheet
• Multi-lesion calculation
Prerequisites • Breast Biopsy Device
• Loop Flex coil, large
|
|
The value of
the clinical applications |
|
The real power of MR imaging lies in
the wide range of applications for which it can be used.
Current applications include soft-tissue delineation,
determining extent of disease, tumor staging, functional
and metabolic information, and monitoring response to
treatment. Some of these newer applications are outlined
herein.
T1- and T2-weighted Imaging
T1- and T2-weighted imaging are the most widely used
sequences for soft-tissue delineation of anatomic
structures and related pathologic conditions. For
example, in the brain, T2-and T1-weighted imaging with
or without contrast material can be used to see changes
in white or gray matter. In other body organs, such as
the breast, extremities, and liver, and in uterine
lesions, imaging has been performed by using T2- and
T1-weighted MR imaging.
Diffusion-weighted and Perfusion-weighted Imaging
Diffusion-weighted imaging (DWI) and perfusion-weighted imaging
(PWI) are used in neurologic applications, such as brain tumor
imaging and cerebral ischemia. The use of perfusion and
diffusion MR imaging techniques can identify regions of abnormal
brain tissue after cerebral ischemia. PWI readily depicts areas
of brain with a compromised cerebral blood flow, whereas DWI can
depict regions of ischemic tissue that may or may not recover,
depending on the duration of reduced blood flow. By combining
PWI and DWI methods, three scenarios can be observed: PWI > DWI
(mismatch), PWI = DWI (match), or DWI > PWI (reverse mismatch).
For example, if PWI is larger than DWI, then the area depicted
may represent “at risk” or penumbral tissue. Evaluation of these
tissue characteristics is important for the targeting of
therapeutic measures to maximize clinical outcomes.
DWI has been used in other organs of the
body, for example, in the liver for demonstration of metastatic
disease and response to treatment, in the uterus for monitoring
treatment response from interventional procedures such as
uterine arterial embolization and high-intensity focused
ultrasound surgery, and for classification of breast lesions.
Still larger studies are needed to fully understand the impact
that DWI will have in these applications.
Spectroscopy
Proton spectroscopy has been used primarily for brain
applications and recently for other organs, such as the liver,
breast, prostate, and soft tissue. The use of spectroscopy
expands the repertoire of clinical information by providing
information on intracellular metabolites, such as choline (3.2
ppm), creatine (3.0 ppm), citrate (2.6 ppm), N-acetyl aspartate
(2.02 ppm), and lactate (1.4 ppm). (The unit “ppm” is defined as
“parts per million” and is independent of the strength of the
imaging unit.)
These metabolites are known to change in
different pathologic conditions; for example, in brain tumors,
N-acetyl aspartate (2.02 ppm) decreases with a subsequent
increase in choline. In the breast, the presence of a choline
peak (3.2 ppm) is suggestive of malignancy. In the prostate, MR
spectroscopy is being increasingly used in conjunction with MR
imaging to provide information on the presence or absence of
citrate (2.6 ppm) and/or choline (3.2 ppm). These applications
will become routine procedures in the near future.
23Na
(Sodium) MR Imaging
Sodium is abundant in most tissues and is actively pumped out of
healthy cells by the Na+/H+-ATPase pump, which maintains a large
concentration difference across the cell membrane at the cost of
energy-rich adenosine triphosphate. Thus, an increase in
intracellular sodium concentration can be a good indicator of
compromised cellular membrane integrity or impaired energy
metabolism. In the presence of tissue perfusion, the
intracellular changes and concurrent increase in vascular or
interstitial volume appear to be an equally good indicator of
cellular membrane integrity and energy metabolism.
The intracellular sodium cannot be imaged
separately from the extracellular sodium concentration without
toxic shift reagents or special MR methods that cause a
significant reduction in SNR and resolution. However, the total
sodium concentration in tissue can be resolved by using MR
imaging, and there has been increased interest in the
application of sodium MR. In particular, sodium imaging has been
performed in the brain, breast, heart, kidney, and uterus. In
recent reports, sodium MR imaging has shown promise in
monitoring therapeutic response.
Beyond 3 T:
Emerging High-Field-Strength MR Imaging (7 T and Greater)
Although there have been vast technological advances in MR
imaging over the past 40 years, the central principle for
advancing MR imaging technology has been based on finding ways
to increase SNR in the MR image. The most fundamental approach
to increasing SNR has been to increase the field strength of the
MR imaging magnets. As a result, the impetus for improved MR
imaging has driven progressive increases in its magnetic field
strengths from fractions of a tesla to fields of 1.5 T in the
1980s then to fields of 3 T by the mid-1990s. The next push for
increasing MR imaging field strength was possible with the
advancement of superconducting technology. In the late 1990s and
early 2000s, the development of a human MR imaging unit above
4.1 T, in this case 8 T, was achieved.
As a result of its tremendous potential, human MR imaging is
currently performed at field strengths reaching 7 T, 8 T, and
9.4 T. The three major MR imaging vendors—GE Healthcare, Siemens
Medical Solutions, and Philips Medical Systems—are developing
7-T whole-body human imaging units. However, as with many
scientific breakthroughs, the potential of
ultrahigh-field-strength imaging can be achieved only if other
challenges are overcome. The most significant of these
challenges include (a) safety concerns regarding exceeding RF
power deposition in tissue and (b) noninherent inhomogeneity of
MR imaging signal detection across the human head.
Conclusions
MR imaging provides a powerful tool for diagnosis and excellent
soft-tissue contrast because the image contrast can be finely
optimized for specific clinical questions. Moreover, novel pulse
sequence techniques allow image contrast to be based on tissue
physiology or even cellular metabolism in a noninvasive manner.
In addition, with ever-increasing improvement in both hardware
and software, MR imaging may one day be used for screening of
different pathologic conditions and provide a window into
cellular metabolism and tissue physiology.
|
|
|


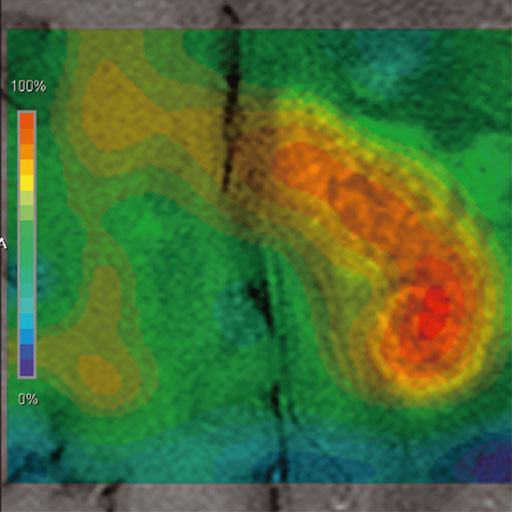
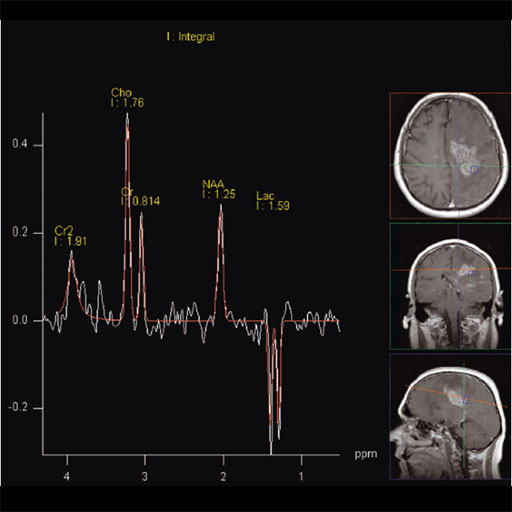
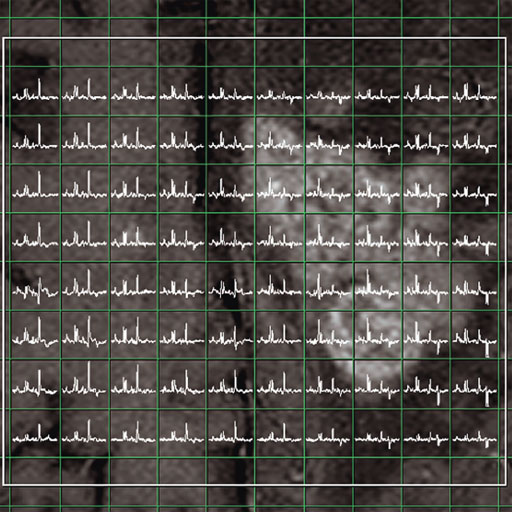
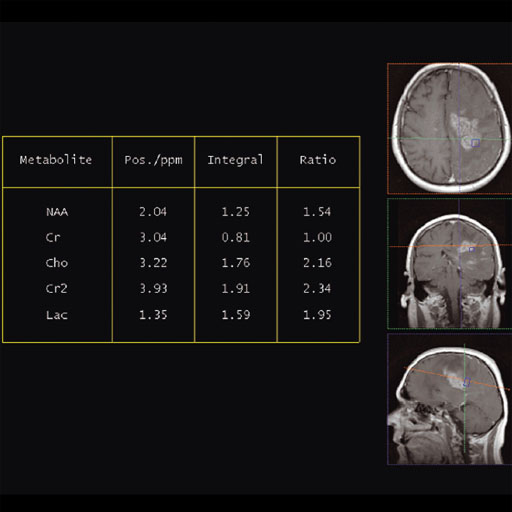
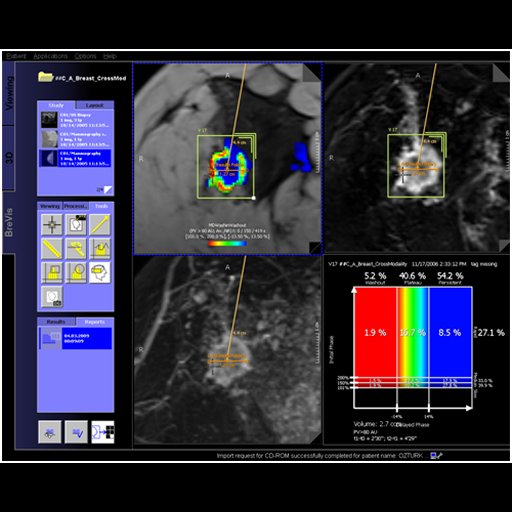
.jpg)